
Our Analytics team has been playing around with Google Analytics App + Web since the product launch in Summer 2019. The more we explore, the more excited we become about the new built-in reports, customized enhanced analysis capabilities, and real-time data stream.
While App + Web differs from our traditional Audience, Acquisition, Behavior, and Conversion reporting in Google Analytics, we’ve found the new event-focused structure to be a refreshing take on our digital data, even if some dimensions and metrics have yet to be ironed out. (Remember, App + Web is still in Beta and should be implemented and utilized in tandem with your existing analytics implementation).
In the following sections, we’ll outline the core reports found in App + Web properties, and highlight some key differences when compared to Google Analytics. We’ll also deep dive into the events and parameter reporting, which may remind you of legacy Firebase reporting.
Not yet familiar with App + Web, or need a refresher on why the analytics community is so excited about this product launch? Check out my colleague's in-depth introduction to the new tool, or catch our recorded webinar.
Why Explore the New App + Web Reports?
While we may be collecting data differently between platforms, most of our Key Performance Indicators (KPIs) and primary business objectives are applicable across devices. The reporting interface within App + Web provides a unified view of our consumers, resulting in more accurate, holistic business decisions.
Extracting our collected data within the App + Web reporting interface is the first step in streamlining insights and speed of decision making. Remember, a data collection strategy is only as strong as the subsequent reporting, so let’s dive in to uncover how your teams can extract meaningful information from the App + Web reports.
The Core Reports
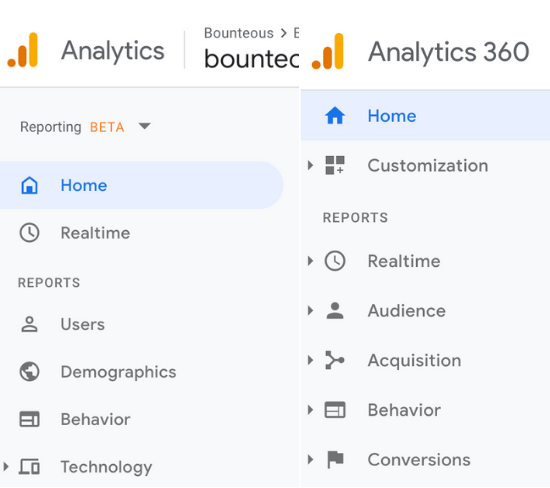
App + Web diverges from the “ABCs,” or Audience, Acquisition, Behavior, and Conversion reporting that we see in Google Analytics today. Instead of placing an emphasis on sessions, App + Web focuses on event-driven marketing — and the reports reflect this shift in logic!
As you start to compare your App + Web data with your existing Google Analytics reports, you may notice that the numbers aren’t an exact match — and that’s totally normal! Because the underlying data model of App + Web is event rather than session-driven, we should expect a bit of a difference between the two. Just make sure that you take note of the differences over time to ensure data quality and consistency.
User Reporting
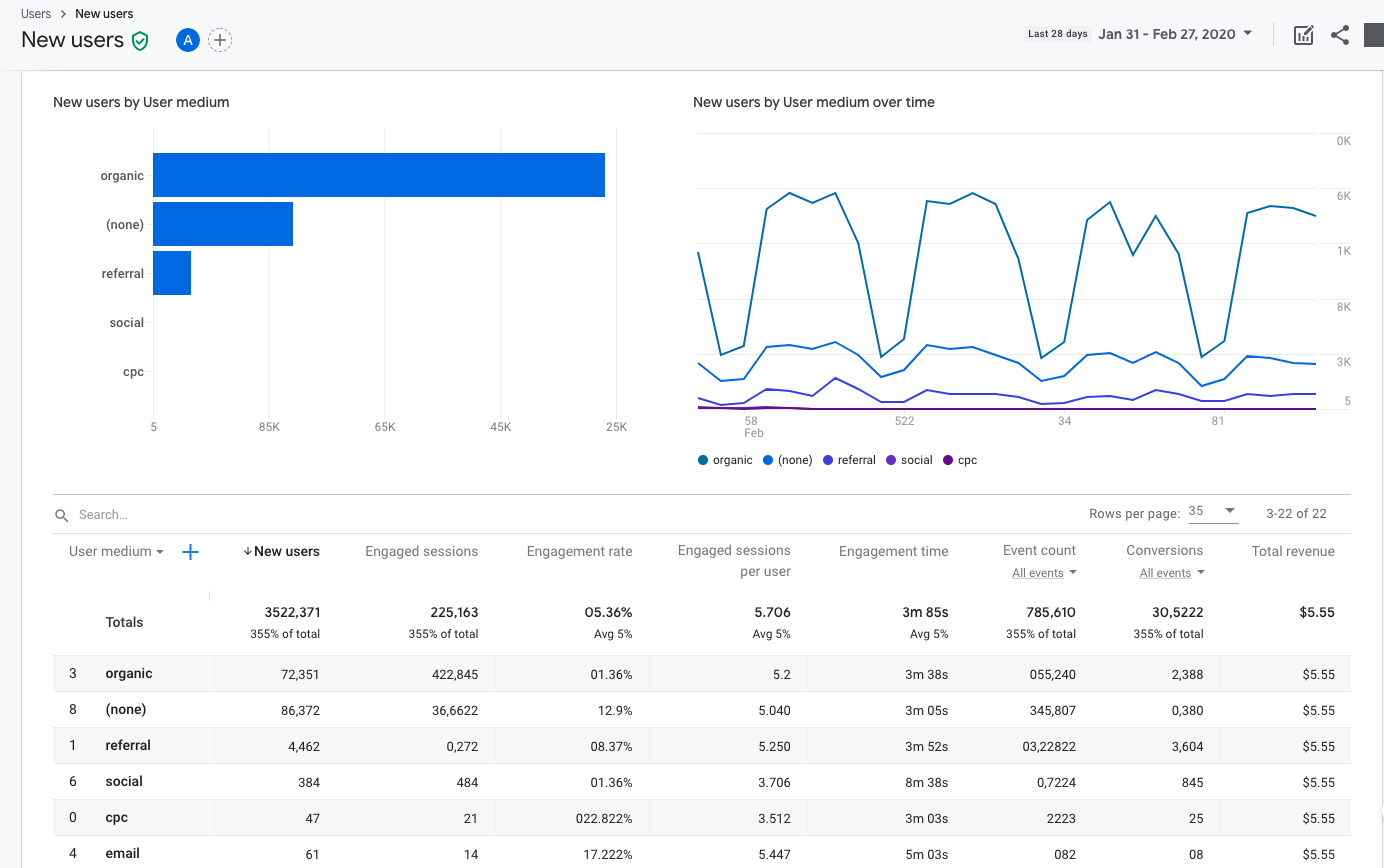
First up in our core reporting lineup is the Users report, which highlights new and returning user metrics and trends much like we see in Google Analytics. However, one major change for App + Web is that the Users reporting also contains our acquisition dimensions and new retention metrics.
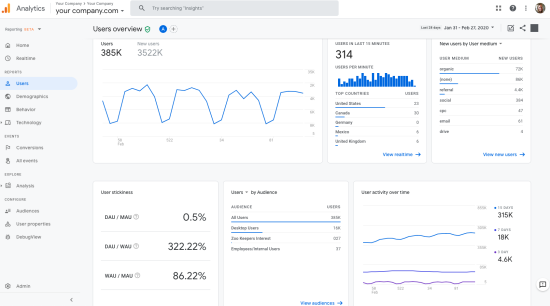
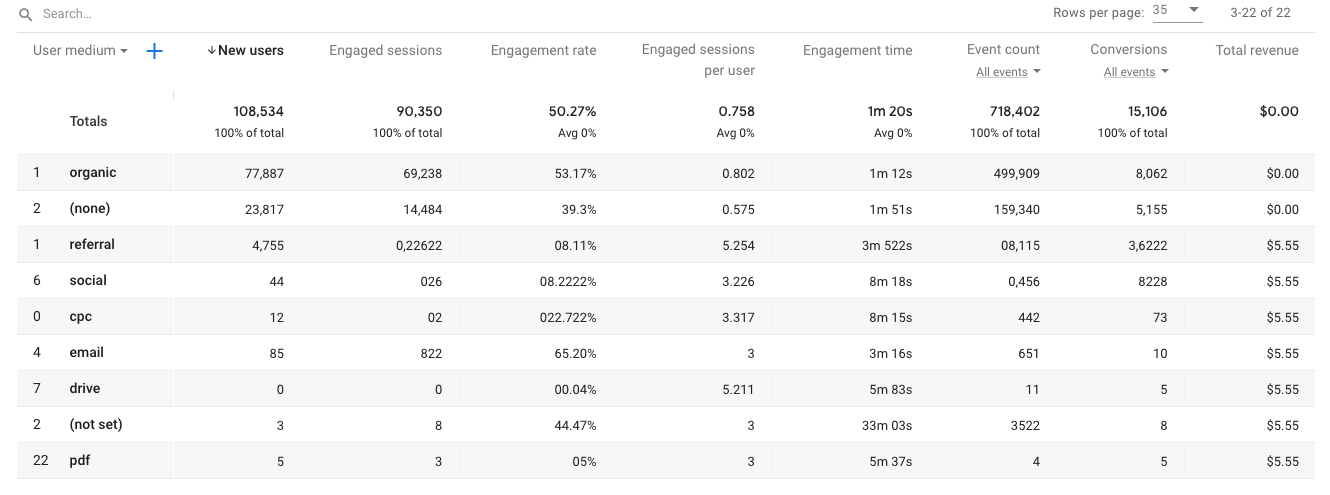
For many of us, the placement of our Acquisition reporting is the most noticeable, and at first, the report may seem a bit sparse. However, App + Web offers us more granularity and the ability to drill down via the blue call to actions located at the bottom of each widget. In this case, the “View new users” CTA will display an entirely new set of reports similar to our Google Analytics “Source/Medium, Source, or Campaign” reports.
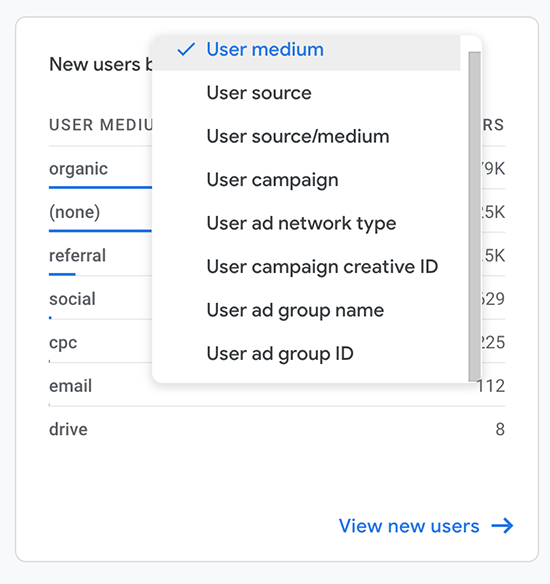

While the overall look and feel of this report is slightly different than what we see in Google Analytics, the functionality is very similar. For example, to update the dimension, simply access the dropdown and choose a new, supported field. You can also add a secondary dimension by clicking the plus sign to the right.
Notice that within our new Users App + Web report we also find a few new metrics: engaged sessions, engagement rate, sessions per user, and time. These new metrics will follow us in all of our core reporting, so it’s important that we get acquainted with them.
First up in our core reporting lineup is the Users report, which highlights new and returning user metrics and trends much like we see in Google Analytics. However, one major change for App + Web is that the Users reporting also contains our acquisition dimensions and new retention metrics.

For many of us, the placement of our Acquisition reporting is the most noticeable, and at first, the report may seem a bit sparse. However, App + Web offers us more granularity and the ability to drill down via the blue call to actions located at the bottom of each widget. In this case, the “View new users” CTA will display an entirely new set of reports similar to our Google Analytics “Source/Medium, Source, or Campaign” reports.
While the overall look and feel of this report is slightly different than what we see in Google Analytics, the functionality is very similar. For example, to update the dimension, simply access the dropdown and choose a new, supported field. You can also add a secondary dimension by clicking the plus sign to the right.
Notice that within our new Users App + Web report we also find a few new metrics: engaged sessions, engagement rate, sessions per user, and time. These new metrics will follow us in all of our core reporting, so it’s important that we get acquainted with them.
The new Engaged sessions metric gives us more context to a user’s behavior than we have previously seen with “bounce rate” in Google Analytics. In App + Web, engaged sessions are defined as any user that has been on the site for at least 10 seconds. If a user has been on the site for less than 10 seconds, they are defined as a bounce.
Engaged sessions per User is the summation of the total number of sessions per user averaged by the total user count. This ratio will be valuable for marketers and analysts to trend over time. The higher the value, the more engaged users a site has.
We also see Engagement time in our App + Web reports, which was previously only available to Firebase users. Engagement time diagnoses screen sleep time, or captures the time in the foreground for a mobile device, to determine how a user is engaging with your content.
Demographics
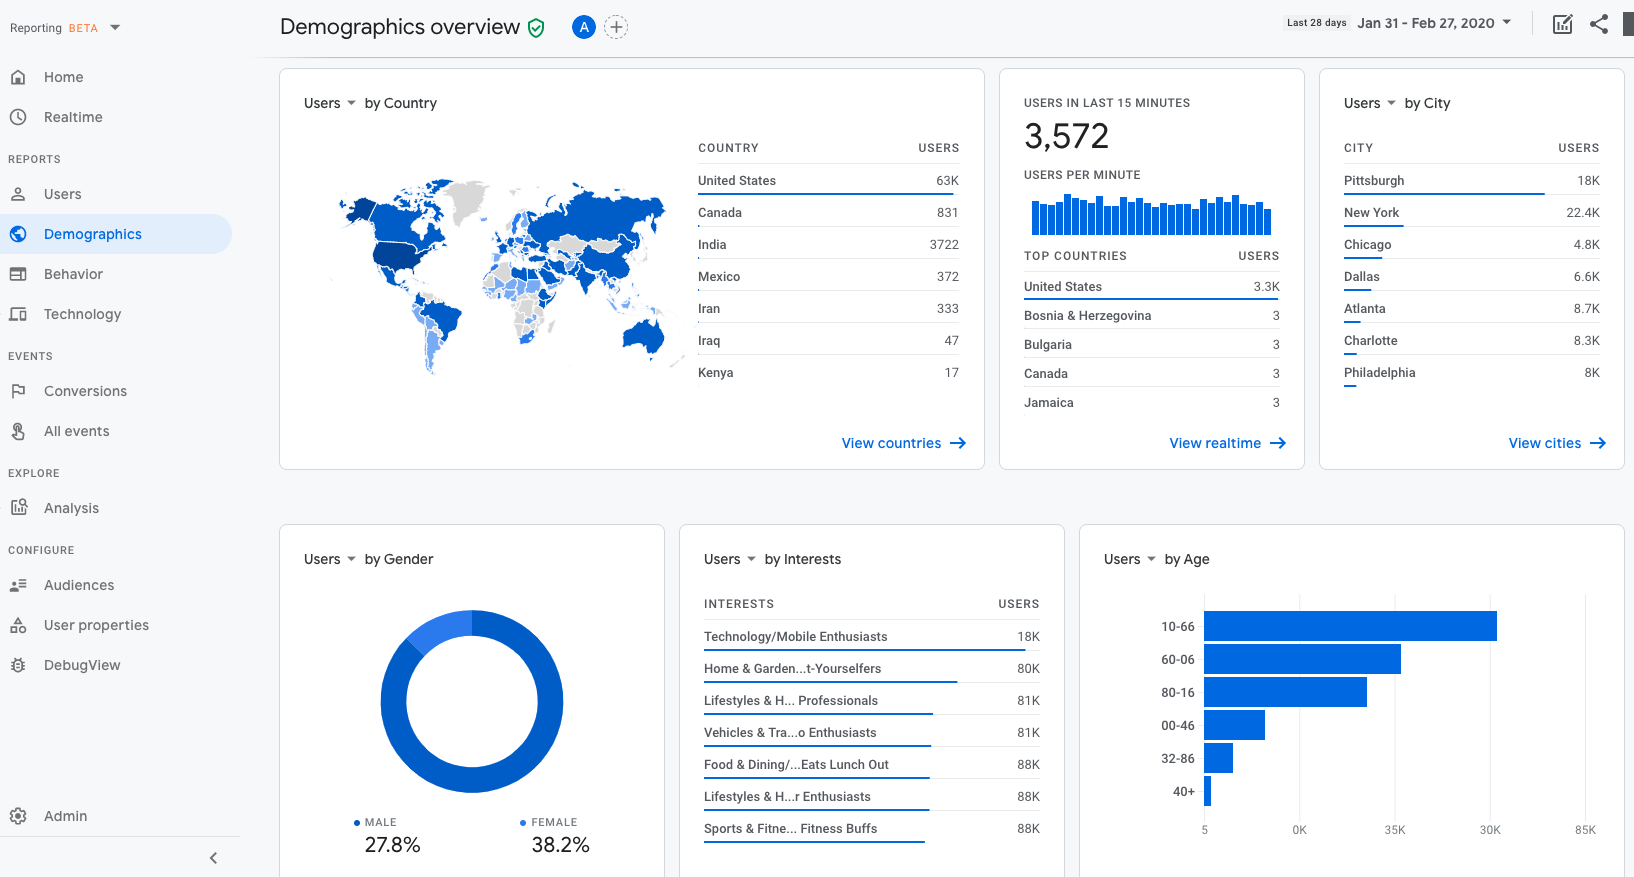
Demographics reporting is intended to give you a high-level overview of which countries, regions, and cities your users are coming to your site or apps from, as well as age and gender information. In App + Web, the default demographics reports are very comparable to what has previously been presented in Google Analytics, but with a few updates including optimized visualizations for user interests or geographic reports.

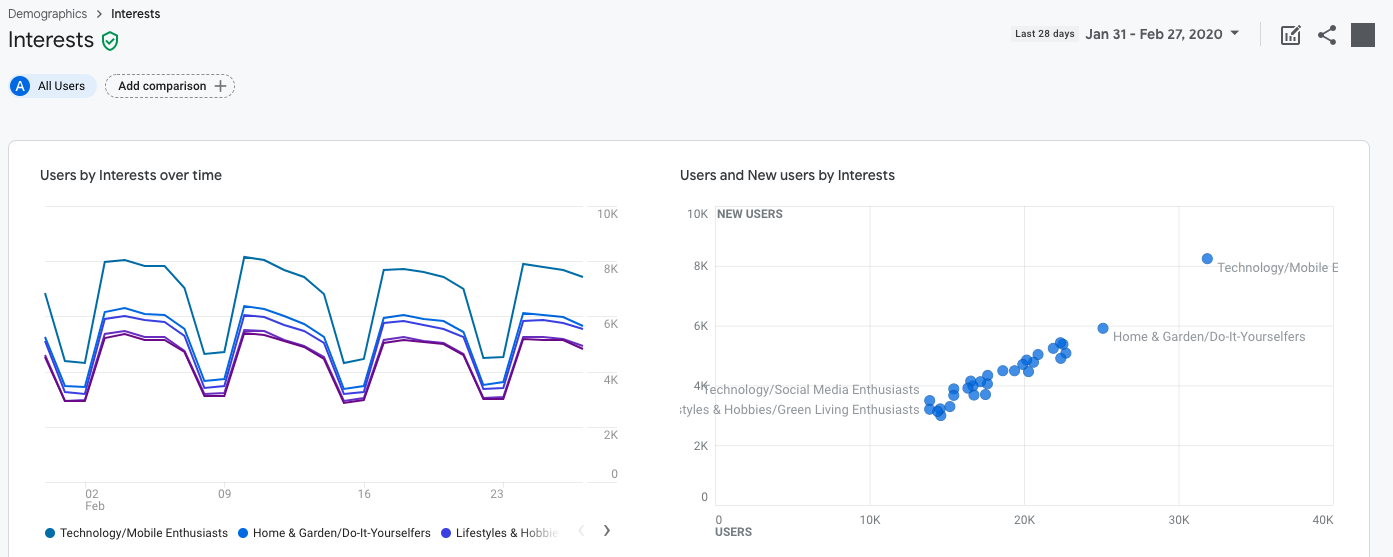
For example, when drilling deeper into user interests, we now have trended interests over time as well as Scatter plots for new user and previous user comparisons.

Scatter plots are a welcome upgrade within the App + Web reporting interface, and pop up regularly in our default reports. Why are we so excited to see new visualizations? Because representations such as scatter plots offer the ability to visually compare relationships between two dimensions without adding in too much complexity.
Demographics reporting is intended to give you a high-level overview of which countries, regions, and cities your users are coming to your site or apps from, as well as age and gender information. In App + Web, the default demographics reports are very comparable to what has previously been presented in Google Analytics, but with a few updates including optimized visualizations for user interests or geographic reports.
For example, when drilling deeper into user interests, we now have trended interests over time as well as Scatter plots for new user and previous user comparisons.
Scatter plots are a welcome upgrade within the App + Web reporting interface, and pop up regularly in our default reports. Why are we so excited to see new visualizations? Because representations such as scatter plots offer the ability to visually compare relationships between two dimensions without adding in too much complexity.
Behavior Reporting
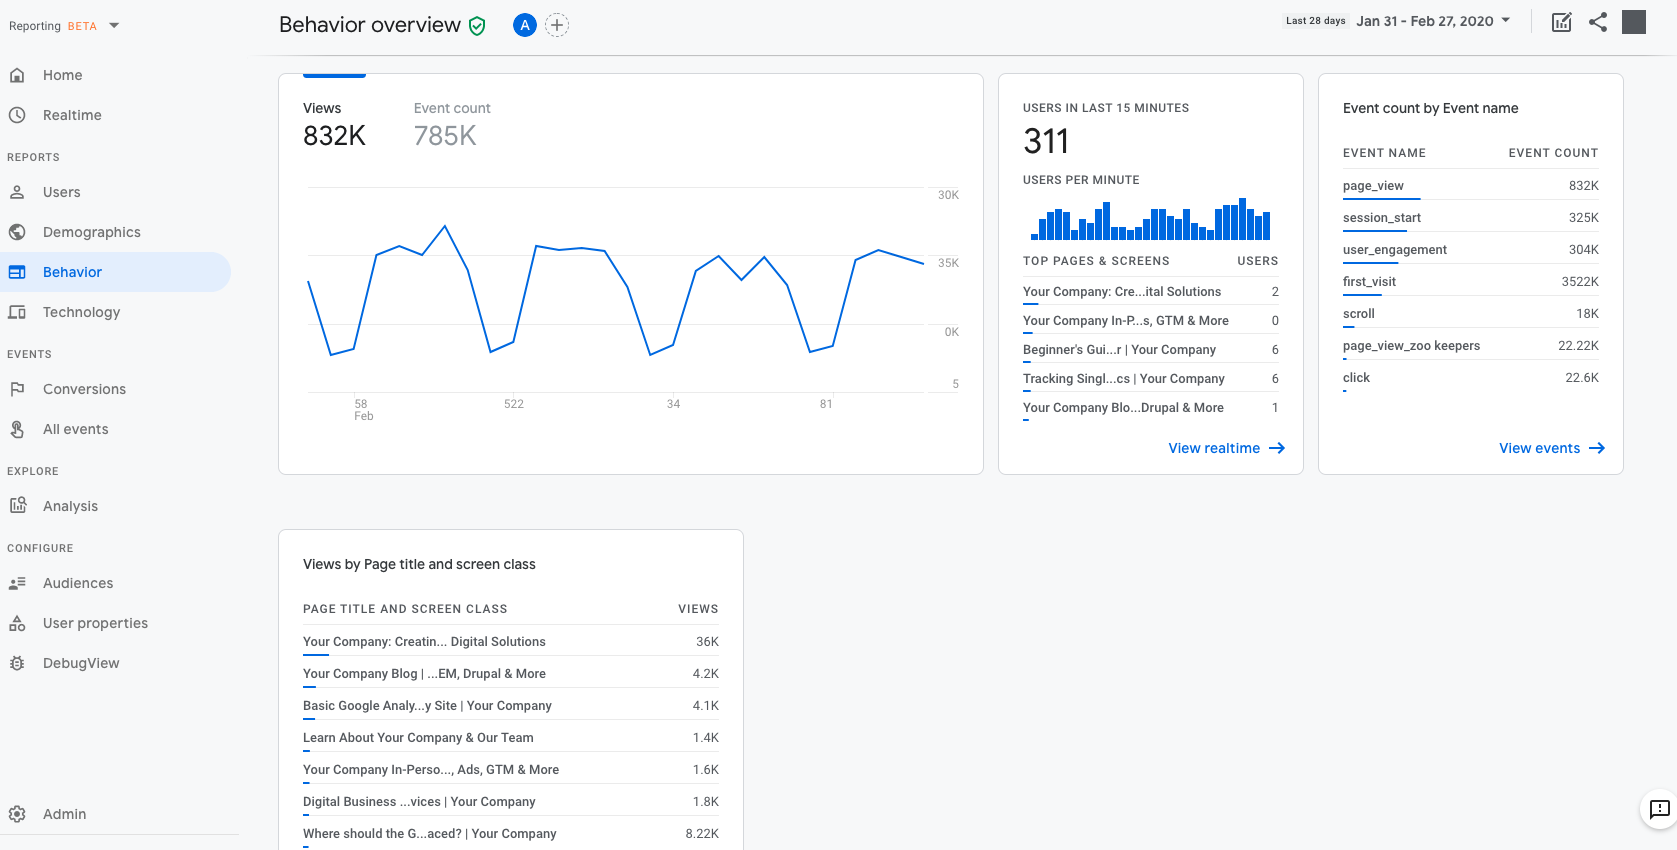
In Google Analytics, behavior reports aim to tell the story of what content your user’s view when visiting your website or app, and what interactions, events, or conversions they complete.
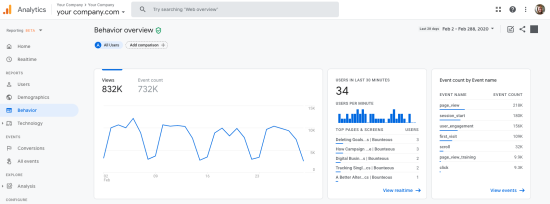
Within App + Web, behavior reporting is broken down into two components: events and pageviews/screenviews. This simplified model helps us get right to the insights, and streamlines the reporting process.

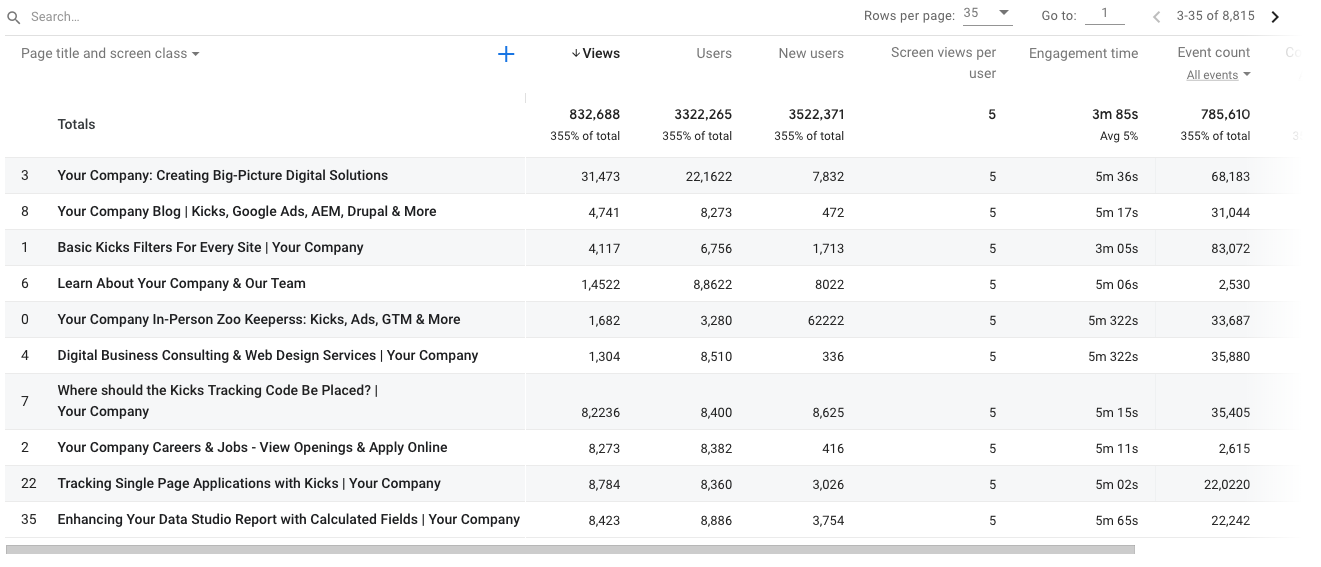
We’ll focus on events in a moment, so, for now, let’s review the Views by Page title and screen class report, which is App + Web’s version of “All Pages” reporting.
Once we are within the detailed view, we notice that a few of our core Google Analytics page metrics are missing from App + Web, including Average time on page, entrances, exits, and bounce rate.

This is a significant shift from our Google Analytics “All Pages” report, which is perhaps the most viewed report within Google Analytics today. While we can replace bounce rate with engagement time, landing pages and exit pages are more challenging to recreate within the provided App + Web interface reporting.
In addition, there are currently no standard or separate landing pages/screens or exit pages/screens report within App + Web. This omission is most likely because of the underlying data model, where our focus is placed on events and users rather than sessions. Additionally, App + Web was built off of the Firebase model (where landing pages may be less pertinent to a mobile app). While we can certainly recreate landing pages or exit pages in BigQuery using the event_timestamp dimension, we are currently not able to report on this data today within the interface (Look for more analysis opportunities in our upcoming posts on App + Web BigQuery solutions).
And finally, App + Web does not currently offer site speed reporting. If you and your teams are relying on this data today, you’ll want to ensure that you continue to maintain your Google Analytics implementation in conjunction with your App + Web property.
In Google Analytics, behavior reports aim to tell the story of what content your user’s view when visiting your website or app, and what interactions, events, or conversions they complete.
Within App + Web, behavior reporting is broken down into two components: events and pageviews/screenviews. This simplified model helps us get right to the insights, and streamlines the reporting process.
We’ll focus on events in a moment, so, for now, let’s review the Views by Page title and screen class report, which is App + Web’s version of “All Pages” reporting.
Once we are within the detailed view, we notice that a few of our core Google Analytics page metrics are missing from App + Web, including Average time on page, entrances, exits, and bounce rate.
This is a significant shift from our Google Analytics “All Pages” report, which is perhaps the most viewed report within Google Analytics today. While we can replace bounce rate with engagement time, landing pages and exit pages are more challenging to recreate within the provided App + Web interface reporting.
In addition, there are currently no standard or separate landing pages/screens or exit pages/screens report within App + Web. This omission is most likely because of the underlying data model, where our focus is placed on events and users rather than sessions. Additionally, App + Web was built off of the Firebase model (where landing pages may be less pertinent to a mobile app). While we can certainly recreate landing pages or exit pages in BigQuery using the event_timestamp dimension, we are currently not able to report on this data today within the interface (Look for more analysis opportunities in our upcoming posts on App + Web BigQuery solutions).
And finally, App + Web does not currently offer site speed reporting. If you and your teams are relying on this data today, you’ll want to ensure that you continue to maintain your Google Analytics implementation in conjunction with your App + Web property.
Site Search
You may be wondering where Site Search went, as these dimensions are not specifically called out in App + Web. Instead of separating site searches, in App + Web site search can be found within our standard events and parameters reporting which we will talk about in a moment.
If you haven’t set up site search events in App + Web or in Google Analytics (but your site offers the capability), do it! Site search reporting can be very useful for understanding which types of content our users are looking for. Additionally, Site Search can be extremely useful for the UX or Product teams, and may identify any gaps in our navigation or product development opportunities.
Technology Reports
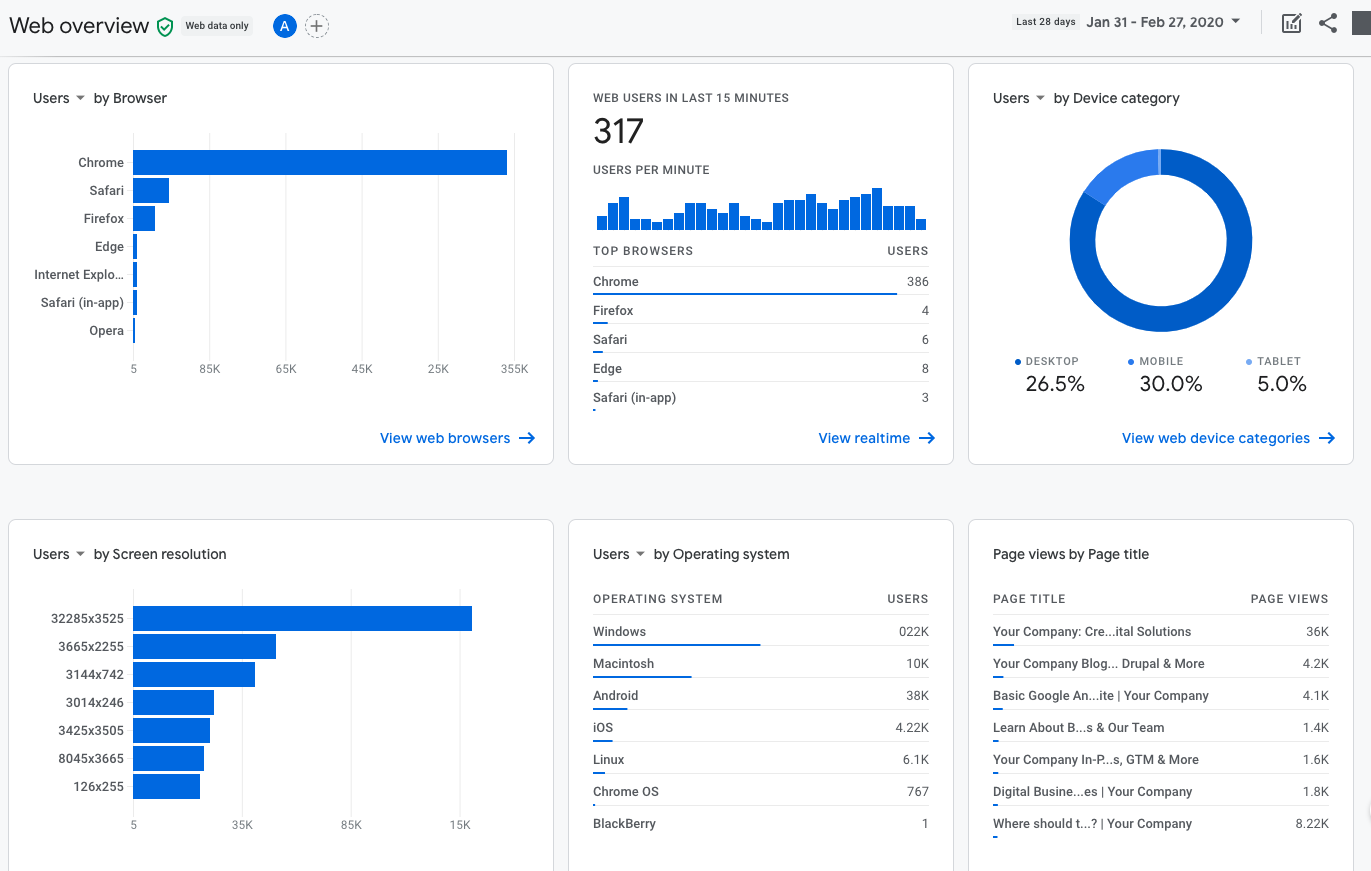
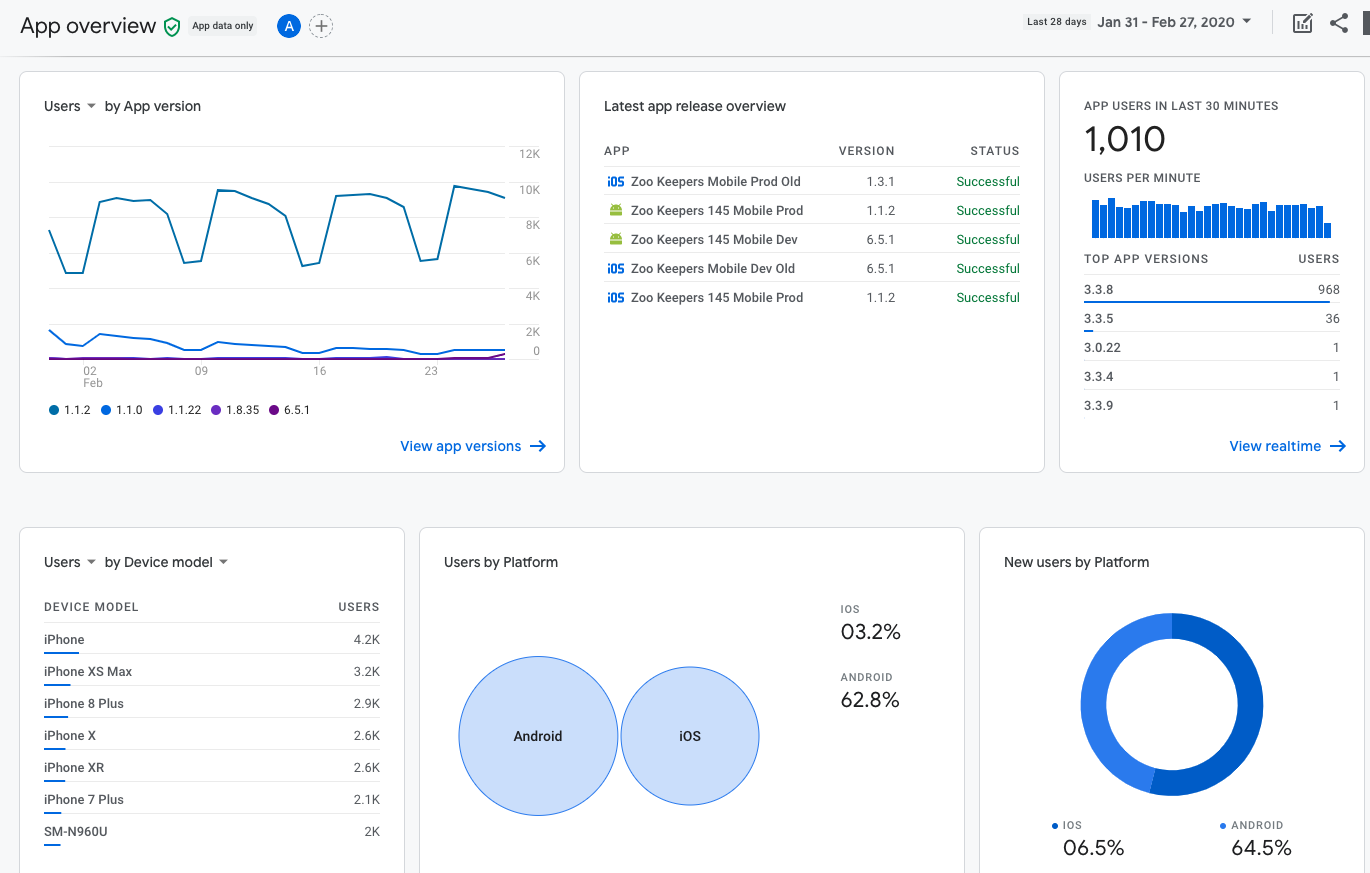
Last but not least, we have our technology reports which give us insights into browser and device types, operating systems, and more. In App + Web, the technology reports are broken out into two sections: Web technologies and App technologies.
Similar to Google Analytics, App + Web offers extensive reporting for our website user’s browser, screen resolution, operating system, and device category reporting.

If you are a previous user of Firebase, you’ll see familiar technology dimensions for your mobile App, including App Version, release, device model, and platform (iOS vs. Android, for example). This type of data can be used to inform new releases and technology upgrades to be compatible with devices and platforms.

As a general statement, we’ve found the technology reports within App + Web to be more than adequate twin siblings for the existing Google Analytics standard reporting. All that’s left is to wait and see if any new dimensions/metrics pop up to address some of our more recent browser and cookie woes!
Last but not least, we have our technology reports which give us insights into browser and device types, operating systems, and more. In App + Web, the technology reports are broken out into two sections: Web technologies and App technologies.
Similar to Google Analytics, App + Web offers extensive reporting for our website user’s browser, screen resolution, operating system, and device category reporting.
If you are a previous user of Firebase, you’ll see familiar technology dimensions for your mobile App, including App Version, release, device model, and platform (iOS vs. Android, for example). This type of data can be used to inform new releases and technology upgrades to be compatible with devices and platforms.
As a general statement, we’ve found the technology reports within App + Web to be more than adequate twin siblings for the existing Google Analytics standard reporting. All that’s left is to wait and see if any new dimensions/metrics pop up to address some of our more recent browser and cookie woes!
Customizing the Core Reports
Now that we’ve gone over the basics, you’ll probably want to customize what you see to your own business. If you are a power user of Google Analytics, you may have created a segment or two in your day, added a regex filter to a report, or are familiar with generating audiences for remarketing campaigns. In App + Web, these types of reporting enhancements are possible through the Customization or Comparison widgets, or within the detailed reporting interface.
Now that we’ve gone over the basics, you’ll probably want to customize what you see to your own business. If you are a power user of Google Analytics, you may have created a segment or two in your day, added a regex filter to a report, or are familiar with generating audiences for remarketing campaigns. In App + Web, these types of reporting enhancements are possible through the Customization or Comparison widgets, or within the detailed reporting interface.
Filtering Data Within Reports
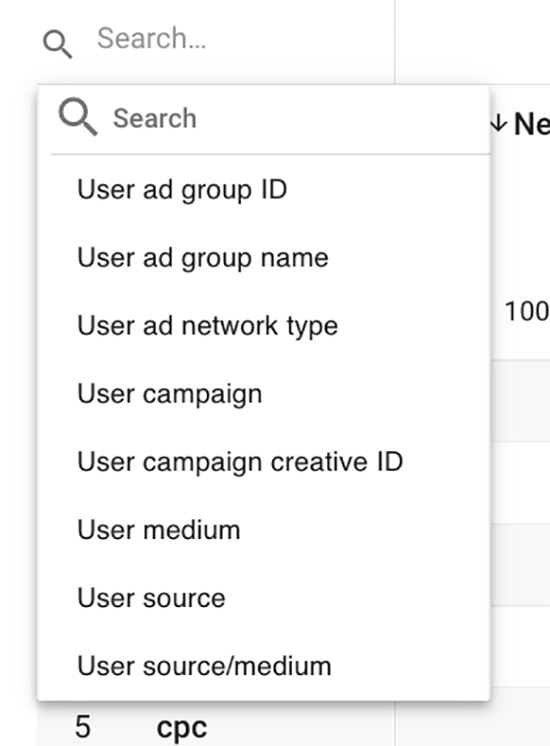
Once you have made your way to a detailed report, you can search and filter for dimensions using the search feature, which can be compared to the Google Analytics Filter tool.
Only interested in Windows operating systems? Simply type in your term and hit go:
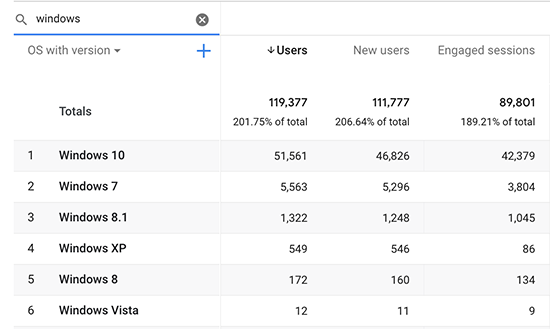
While the search design is a bit more visibly pleasing than Google Analytics, the functionality differs slightly within App + Web. For example, we currently do not have the ability to create regular expressions within our searches. There are also limited capabilities around chaining “include” or “exclude” filters, as well as the ability to search for specific values by individual dimension (if multiple dimensions are applied).
Since App + Web is in Beta, we expect these features to be added over time. Just note that you may need to create more segments (comparisons!) than you may have in the past.
Adding Comparisons & Creating Audiences (The New Segment!)
Once you have made your way to a detailed report, you can search and filter for dimensions using the search feature, which can be compared to the Google Analytics Filter tool.
Only interested in Windows operating systems? Simply type in your term and hit go:
While the search design is a bit more visibly pleasing than Google Analytics, the functionality differs slightly within App + Web. For example, we currently do not have the ability to create regular expressions within our searches. There are also limited capabilities around chaining “include” or “exclude” filters, as well as the ability to search for specific values by individual dimension (if multiple dimensions are applied).
Since App + Web is in Beta, we expect these features to be added over time. Just note that you may need to create more segments (comparisons!) than you may have in the past.
Adding Comparisons & Creating Audiences (The New Segment!)
Adding Comparisons
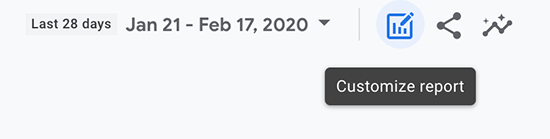
Comparing the differences and similarities between populations of users is a great use case for Google Analytics. You can access the customization tool to create a new, temporary comparison on any report by clicking “Add Comparison” or “Customize Report” from the top navigation.
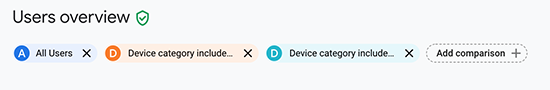
From here, we have the opportunity to create up to four comparisons (or segments) to be included in each reporting element.
Why might you want to use this feature? Just like segments in Google Analytics, App + Web comparisons are powerful ways to slice and dice your data, or isolate specific populations that may behave differently while visiting your website or app.
For example, you might be interested in seeing how users on a mobile device interact with your site, or access your landing pages compared to those on a desktop. Creating a comparison will enable you to visually assess your dimensions as they relate to each other.
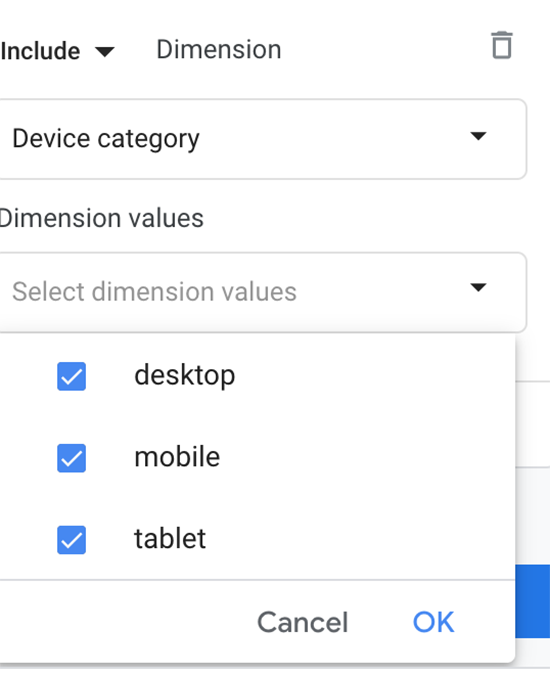
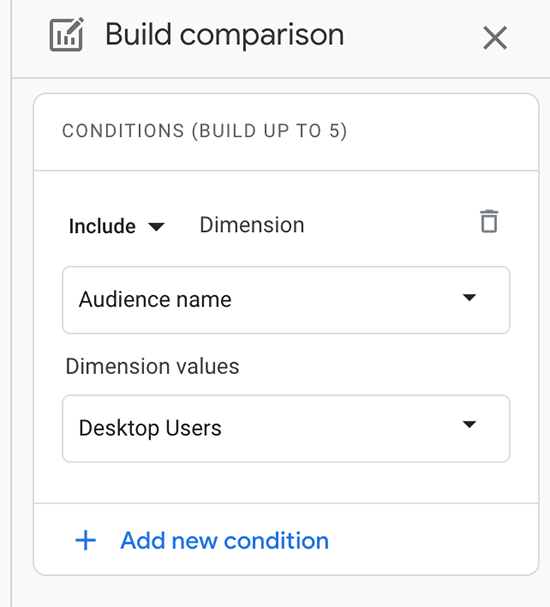
Let’s use mobile vs. desktop as an example. We first create comparisons by selecting a dimension, and using the checkbox feature to isolate specific attributes, such as mobile or desktop. We can also “include” or “exclude” multiple dimensions in one comparison, much like segments.
Once we’ve created each comparison, your left-hand panel may look something like the following image, where you’ll notice we can also choose the attribution type. If you are accustomed to the multi-channel funnel reports or model comparison reports in Google Analytics, these attribution types will look familiar to you.
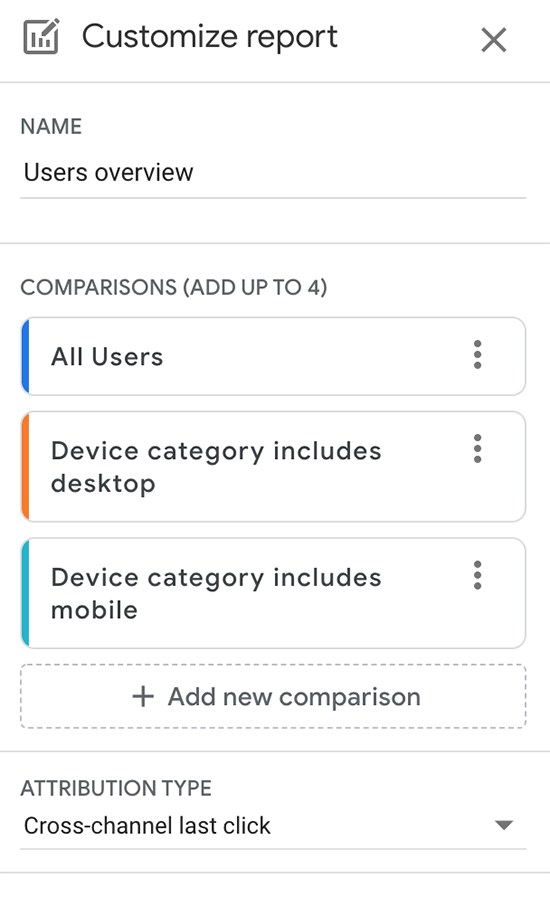
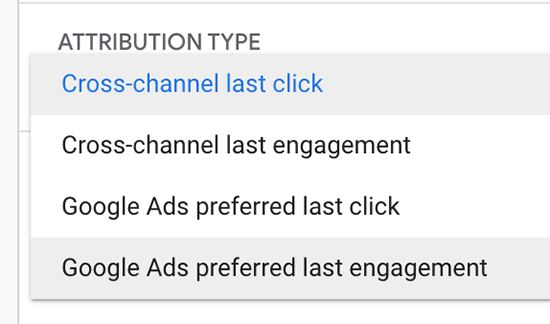
By default, App + Web applies cross-channel last-click attribution to each event or conversion. Cross-channel last click will give us clicks from all sources and attributes the conversion to the last non-direct (source) click.
After applying our comparisons, each App + Web report widget will display the separate population for easy analysis. For example, we can infer from the following data that most users on a mobile device access the website or mobile app directly, while our desktop users access our content primarily through a search engine organically.

Although comparing users by the device is a relatively simple example, App + Web user comparisons can get as detailed as you wish.
Note that these features can be utilized across all of your App + Web reports, just like segments! They are also “sticky,” and will follow you from report to report as you navigate the interface.
Comparing the differences and similarities between populations of users is a great use case for Google Analytics. You can access the customization tool to create a new, temporary comparison on any report by clicking “Add Comparison” or “Customize Report” from the top navigation.
From here, we have the opportunity to create up to four comparisons (or segments) to be included in each reporting element.
Why might you want to use this feature? Just like segments in Google Analytics, App + Web comparisons are powerful ways to slice and dice your data, or isolate specific populations that may behave differently while visiting your website or app.
For example, you might be interested in seeing how users on a mobile device interact with your site, or access your landing pages compared to those on a desktop. Creating a comparison will enable you to visually assess your dimensions as they relate to each other.
Let’s use mobile vs. desktop as an example. We first create comparisons by selecting a dimension, and using the checkbox feature to isolate specific attributes, such as mobile or desktop. We can also “include” or “exclude” multiple dimensions in one comparison, much like segments.
Once we’ve created each comparison, your left-hand panel may look something like the following image, where you’ll notice we can also choose the attribution type. If you are accustomed to the multi-channel funnel reports or model comparison reports in Google Analytics, these attribution types will look familiar to you.
By default, App + Web applies cross-channel last-click attribution to each event or conversion. Cross-channel last click will give us clicks from all sources and attributes the conversion to the last non-direct (source) click.
After applying our comparisons, each App + Web report widget will display the separate population for easy analysis. For example, we can infer from the following data that most users on a mobile device access the website or mobile app directly, while our desktop users access our content primarily through a search engine organically.
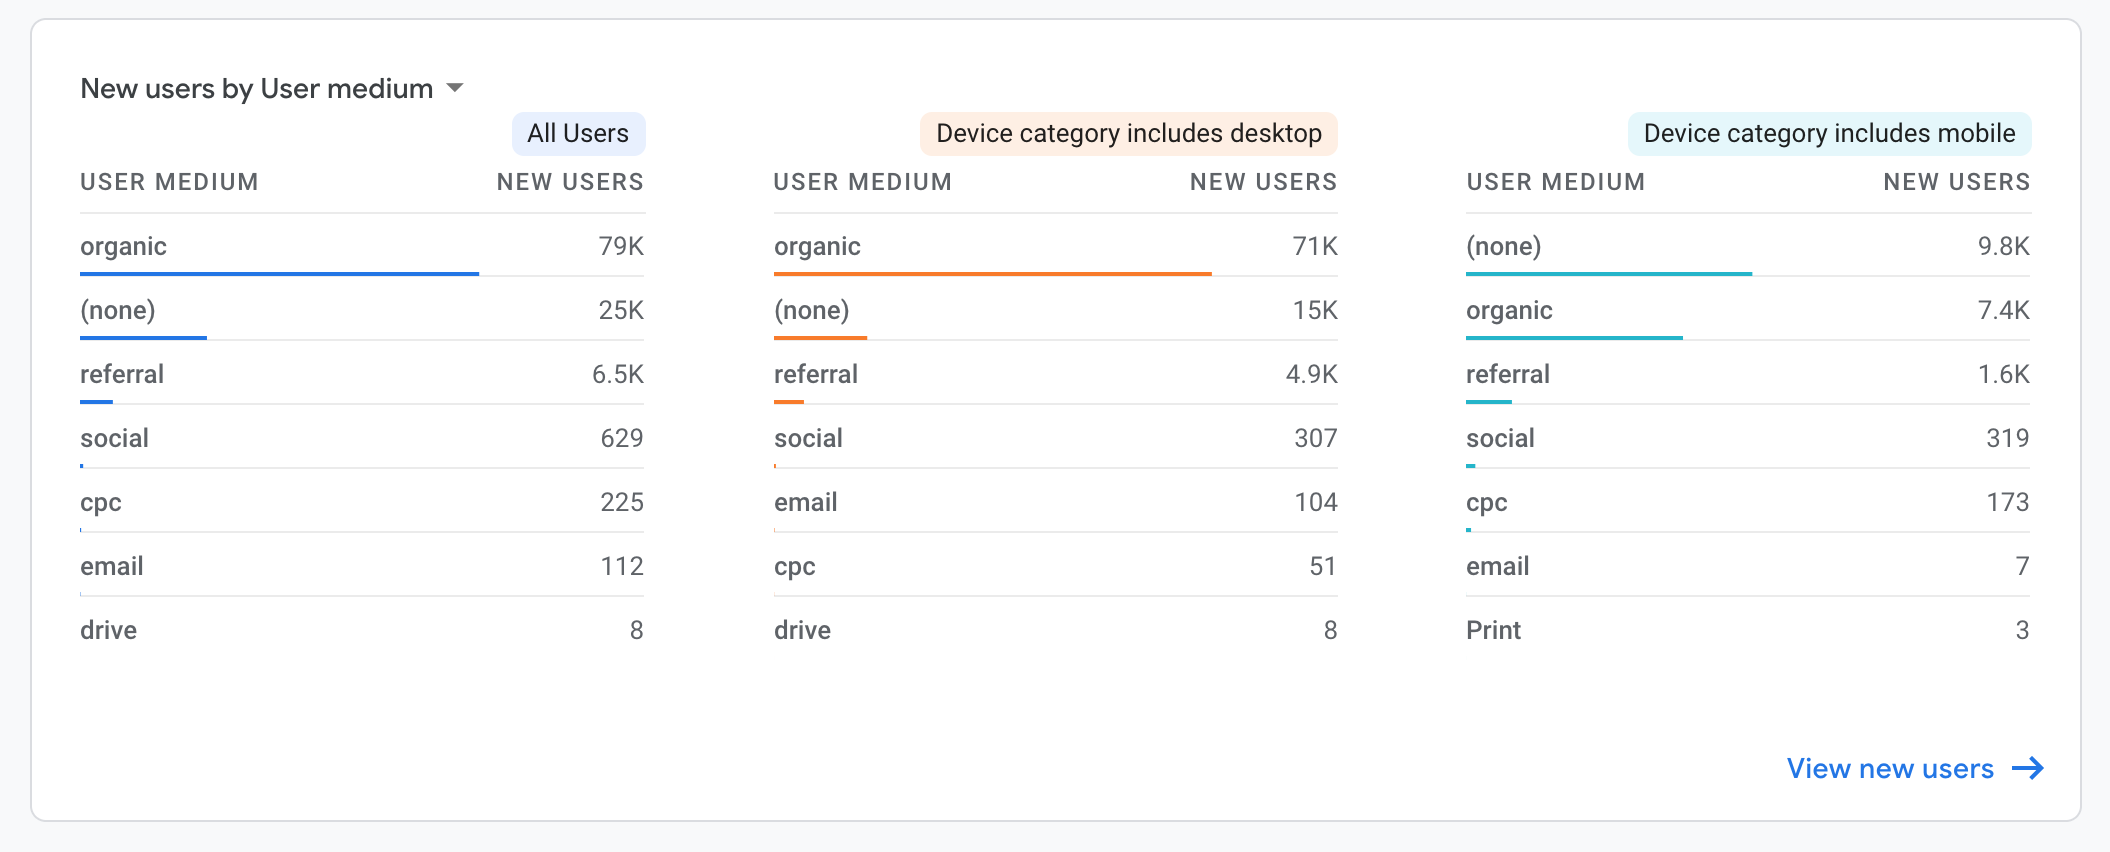
Although comparing users by the device is a relatively simple example, App + Web user comparisons can get as detailed as you wish.
Note that these features can be utilized across all of your App + Web reports, just like segments! They are also “sticky,” and will follow you from report to report as you navigate the interface.
Creating & Saving Audiences
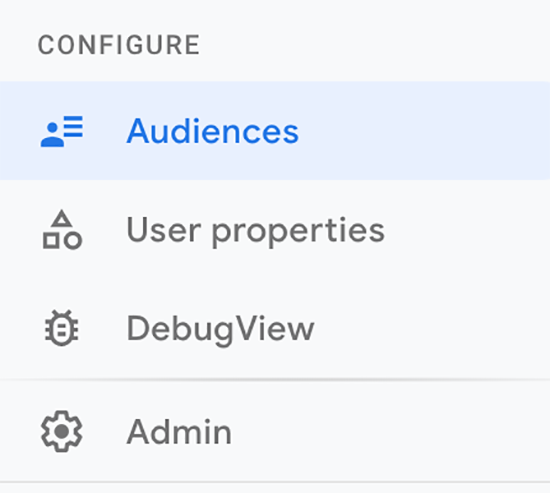
If you’d like to save a comparison for future use, you’ll probably want to create an audience instead. Audiences are comparisons that are managed separately within App + Web, and can be accessed via the left-hand navigation under “Configure.”
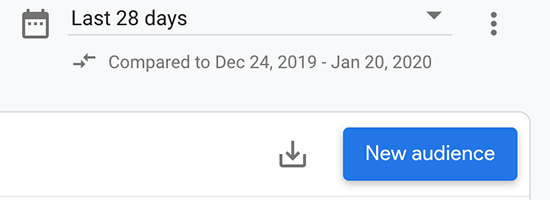
Once you’ve made it to the audiences page, you’ll select “New Audience” to create a saved comparison. The New Audience button can be found at the top right of the interface, below the date range selector.
While the interface appears slightly different than Google Analytics today, Audiences are configured much like segments. In the following example, we’ve created an audience to include only desktop users. We can also provide more detailed specifics, including scoping the audience to a specific session, at any point in their history on our site or app, or within a specified event.

Like the much-loved Google Analytics segment functionality, Audiences can be created by including condition, sequence, or exclusion.
Once we have an audience that we are pleased with, we can add this audience to a comparison using the same features outlined earlier. These audiences will then be displayed across each reporting widget in App + Web.
If you’d like to save a comparison for future use, you’ll probably want to create an audience instead. Audiences are comparisons that are managed separately within App + Web, and can be accessed via the left-hand navigation under “Configure.”
Once you’ve made it to the audiences page, you’ll select “New Audience” to create a saved comparison. The New Audience button can be found at the top right of the interface, below the date range selector.
While the interface appears slightly different than Google Analytics today, Audiences are configured much like segments. In the following example, we’ve created an audience to include only desktop users. We can also provide more detailed specifics, including scoping the audience to a specific session, at any point in their history on our site or app, or within a specified event.
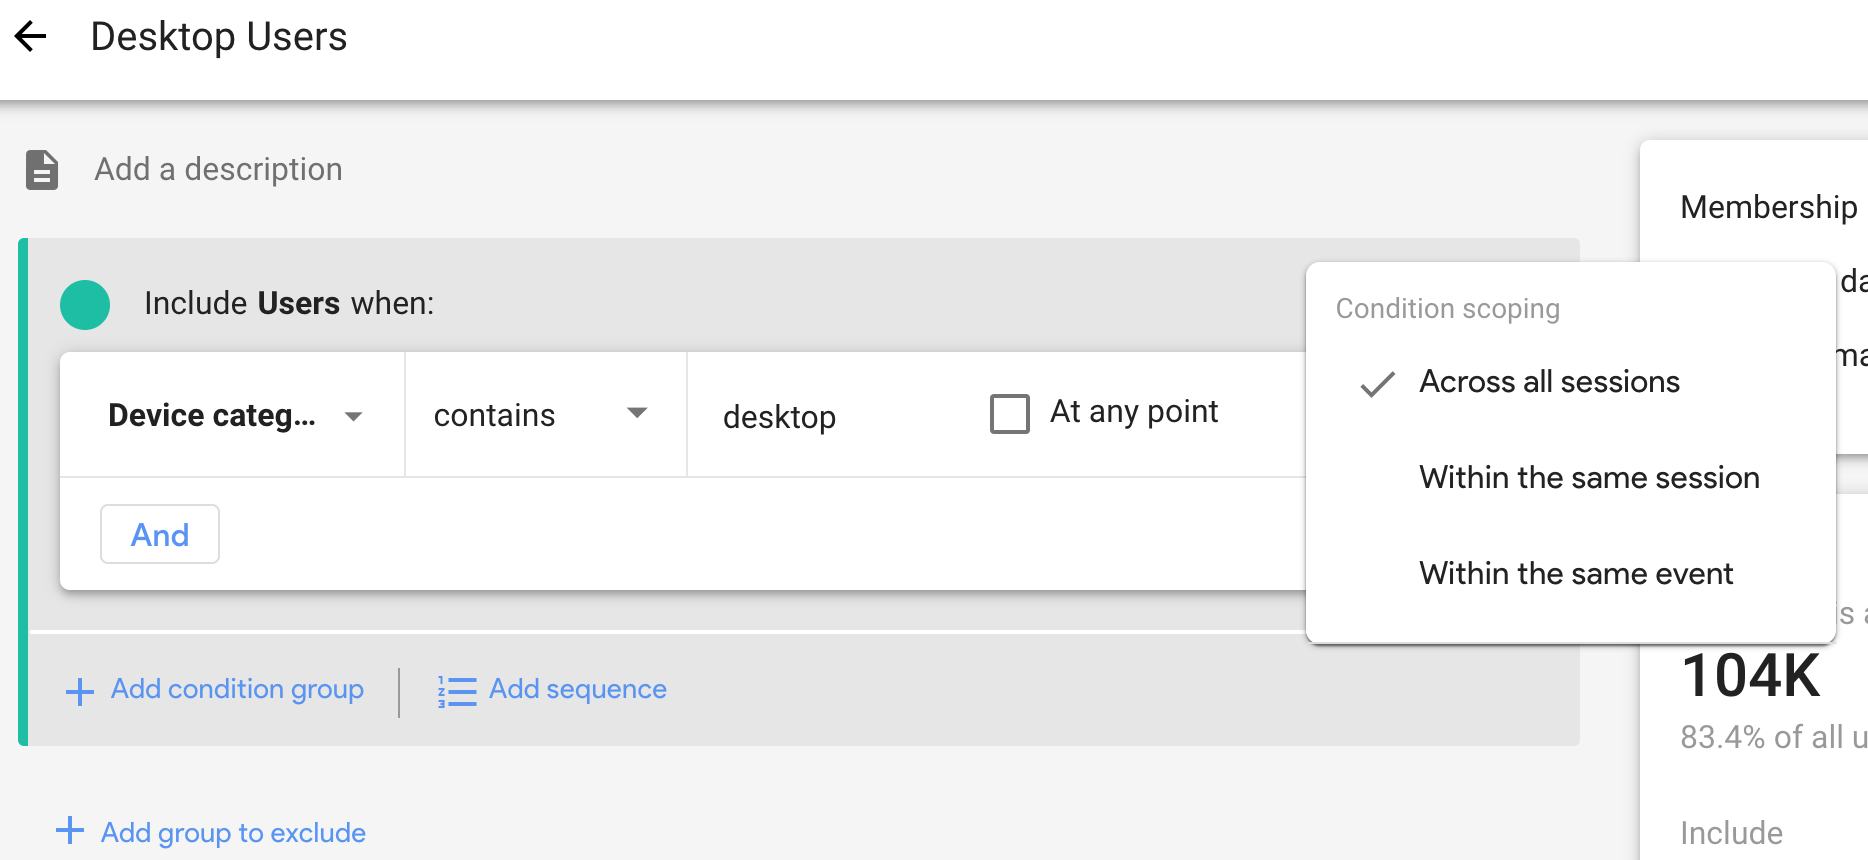
Like the much-loved Google Analytics segment functionality, Audiences can be created by including condition, sequence, or exclusion.
Once we have an audience that we are pleased with, we can add this audience to a comparison using the same features outlined earlier. These audiences will then be displayed across each reporting widget in App + Web.
Conversions, Events, & Event Parameters
Another major difference between App + Web and Google Analytics is the emphasis placed on events to represent conversions vs. goals. In our traditional Google Analytics reporting, events were located within our Behavior reports while conversions were treated separately via Goals or eCommerce. In App + Web, the streamlined data model removes many of our session-scoped data points and relies solely on event data to support our conversions. In both cases, identifying an action that a user takes on your website or app as a conversion requires some interface administration.
Event & Conversion Reporting
In Google App + Web, we collect events to provide data points for user activity on our website or app similar to Google Analytics. The primary difference is that we are no longer confined to the event Category, Action, and Label syntax. Instead, App + Web introduces a concept from Firebase: event parameters.
We can access our event & conversion reporting via the left-hand navigation under “Events” — pretty intuitive!
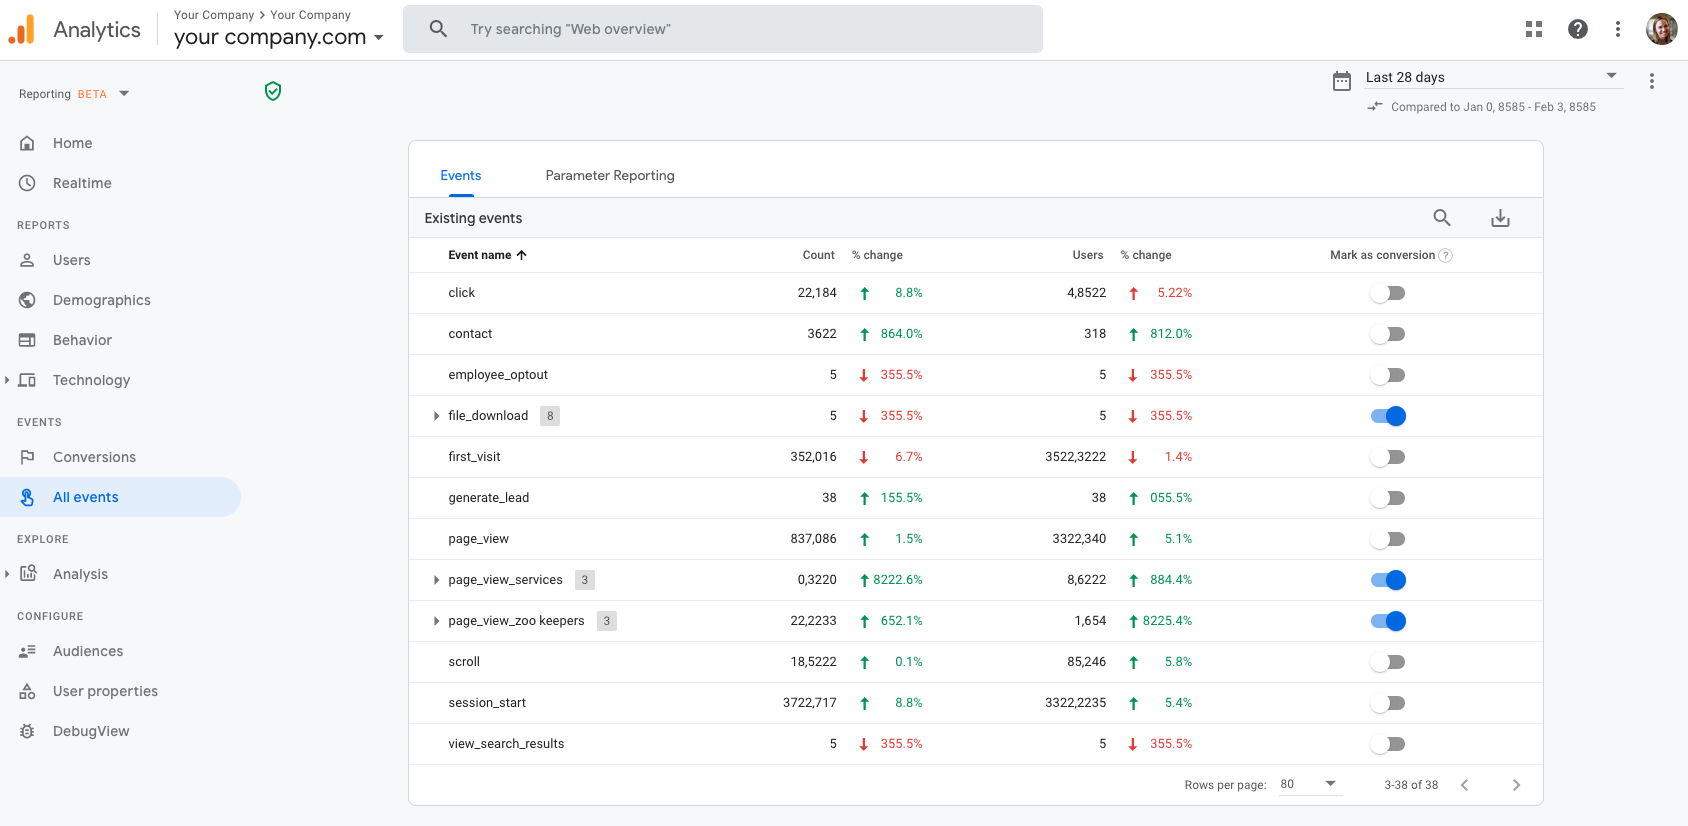
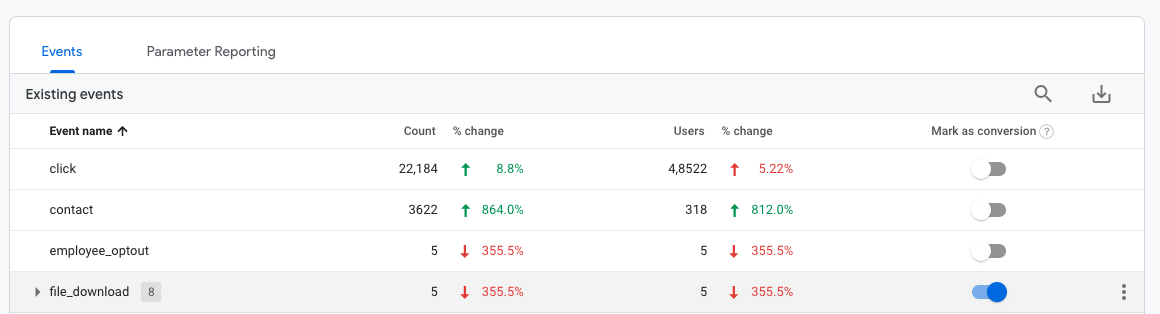
Within the Event interface, you’ll see the Event Name, the total number of events that occurred within the time frame, users per event, and the % change from the comparison date located in the top right. If you have hundreds of unique event names (you can have up to 500 in App + Web), you can also use the search feature to find specific event names or groups.

This report might be similar to your existing “Top Events” reporting in Google Analytics, where we look at the top event Category and the associated metrics. However, we have a few new features within App + Web, including marking an event as a conversion and parameter reporting.
Marking an Event as a Conversion
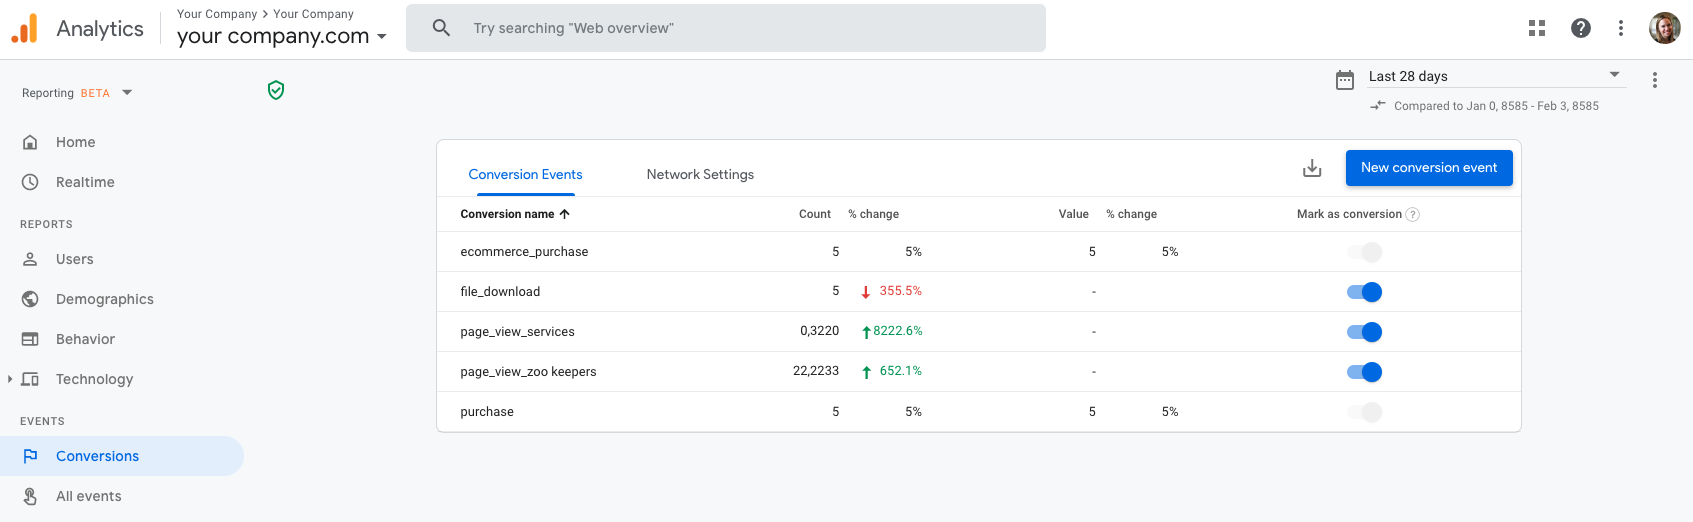
To mark an event in App + Web as a conversion, simply slide conversion the toggle to the right (it will become blue). Once this is completed, we’ll be able to see these events within our conversion report in App + Web.

Notice that there are purchase events in our interface example. These events will automatically be marked as conversions in App + Web as they are part of the recommended event list.
When might we want to mark an event as a conversion? Think back to your existing Goals in your Google Analytics implementation. Conversions are any event or action that represents the underlying reason(s) that you have a website or an app. Conversions for a B2B site might be filling out a lead generation form, or calling a representative. For a content site, a conversion might be downloading a file, viewing a key page of content, or watching a video. For an eCommerce site, a conversion might be as simple as purchasing a product.
Moreover, we can make better use of our default interface reporting when we mark an event as a conversion. This is because conversions are displayed in many of our App + Web reports just like we saw in Google Analytics. We can also select each individual conversion from the drop-down menu to dive into specifics.

Another major difference between App + Web and Google Analytics is the emphasis placed on events to represent conversions vs. goals. In our traditional Google Analytics reporting, events were located within our Behavior reports while conversions were treated separately via Goals or eCommerce. In App + Web, the streamlined data model removes many of our session-scoped data points and relies solely on event data to support our conversions. In both cases, identifying an action that a user takes on your website or app as a conversion requires some interface administration.
Event & Conversion Reporting
In Google App + Web, we collect events to provide data points for user activity on our website or app similar to Google Analytics. The primary difference is that we are no longer confined to the event Category, Action, and Label syntax. Instead, App + Web introduces a concept from Firebase: event parameters.
We can access our event & conversion reporting via the left-hand navigation under “Events” — pretty intuitive!
Within the Event interface, you’ll see the Event Name, the total number of events that occurred within the time frame, users per event, and the % change from the comparison date located in the top right. If you have hundreds of unique event names (you can have up to 500 in App + Web), you can also use the search feature to find specific event names or groups.
This report might be similar to your existing “Top Events” reporting in Google Analytics, where we look at the top event Category and the associated metrics. However, we have a few new features within App + Web, including marking an event as a conversion and parameter reporting.
Marking an Event as a Conversion
To mark an event in App + Web as a conversion, simply slide conversion the toggle to the right (it will become blue). Once this is completed, we’ll be able to see these events within our conversion report in App + Web.
Notice that there are purchase events in our interface example. These events will automatically be marked as conversions in App + Web as they are part of the recommended event list.
When might we want to mark an event as a conversion? Think back to your existing Goals in your Google Analytics implementation. Conversions are any event or action that represents the underlying reason(s) that you have a website or an app. Conversions for a B2B site might be filling out a lead generation form, or calling a representative. For a content site, a conversion might be downloading a file, viewing a key page of content, or watching a video. For an eCommerce site, a conversion might be as simple as purchasing a product.
Moreover, we can make better use of our default interface reporting when we mark an event as a conversion. This is because conversions are displayed in many of our App + Web reports just like we saw in Google Analytics. We can also select each individual conversion from the drop-down menu to dive into specifics.
Let’s Talk Event Parameters
App + Web events are subject to the same criteria that you may have experienced when setting up Firebase for your mobile app: you can send up to 25 event parameters per hit. This is a hard limit, and if you exceed 25 parameters App + Web will choose to randomly drop the excess without providing insight into which parameter will be let go.
Once you determine which 25 (or fewer) parameters you’d like to send with each hit, you’ll be able to see each of these parameters in your BigQuery export if you’ve enabled the integration. (Jump down to the BigQuery section below for more information on this awesome opportunity when using App + Web).
However, you may initially wonder where to find these parameters in App + Web. Unlike Google Analytics, not all hit information is not sent to your reporting interface. In fact, we actually need to register which event parameters we want to see in our reports for each individual event name.
Registering Event Parameters
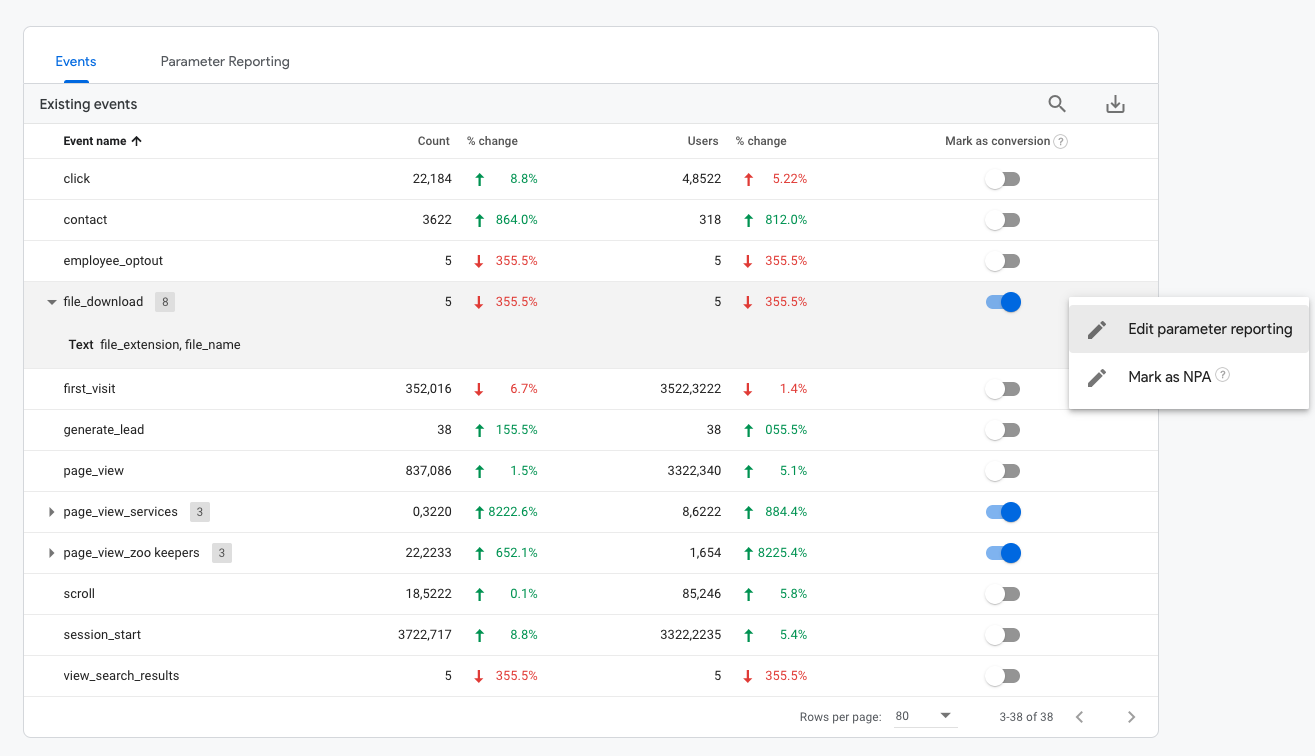
You may have noticed in our previous All Events report screenshot that a few of our events had expansion arrows. This is an indicator that we have registered event parameters to be able to be viewed in the report interface.

In App + Web, you are able to register 50 text parameters and 50 numerical parameters to be shown within the “Parameter Reporting” tab. The most important item to note is that these limits apply per event and per project. Each time a parameter is enabled for a single event, the number of parameters available is reduced.
For example, maybe you want to add a URL as an event parameter for “social_click” and “outbound_link”. While the event parameter is the same (and even named the same in the interface), it will be counted as 2 of 50 text parameters, leaving you with 48 remaining.
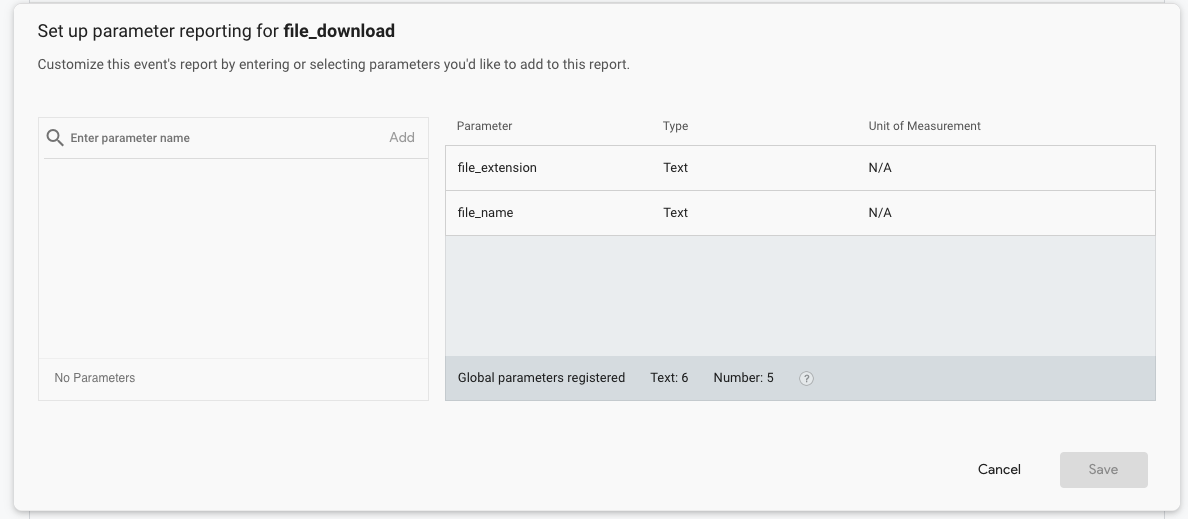
To register a parameter, you can hover over the specific event within the interface until you see three dots appear to the right.

From this menu, choose edit parameter reporting, and select the parameters from the left-hand side to be included in your reporting.

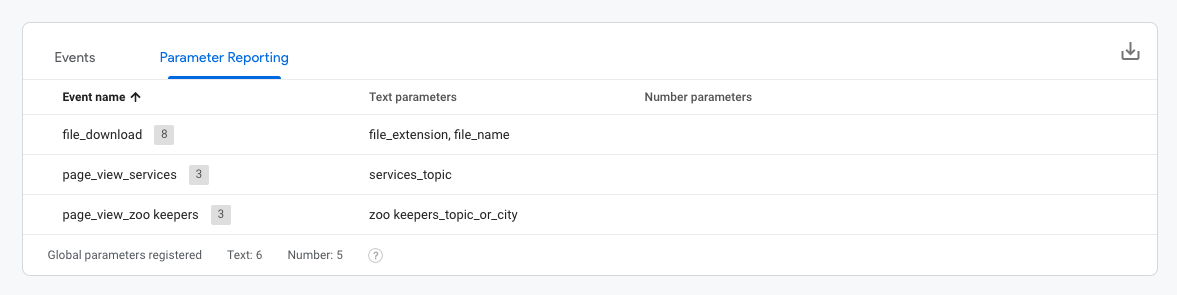
Click Save once you’ve added the appropriate parameters to the event. You’ll also be able to see a summary of each event, parameter, and registered totals under the “Parameter Reporting” tab.

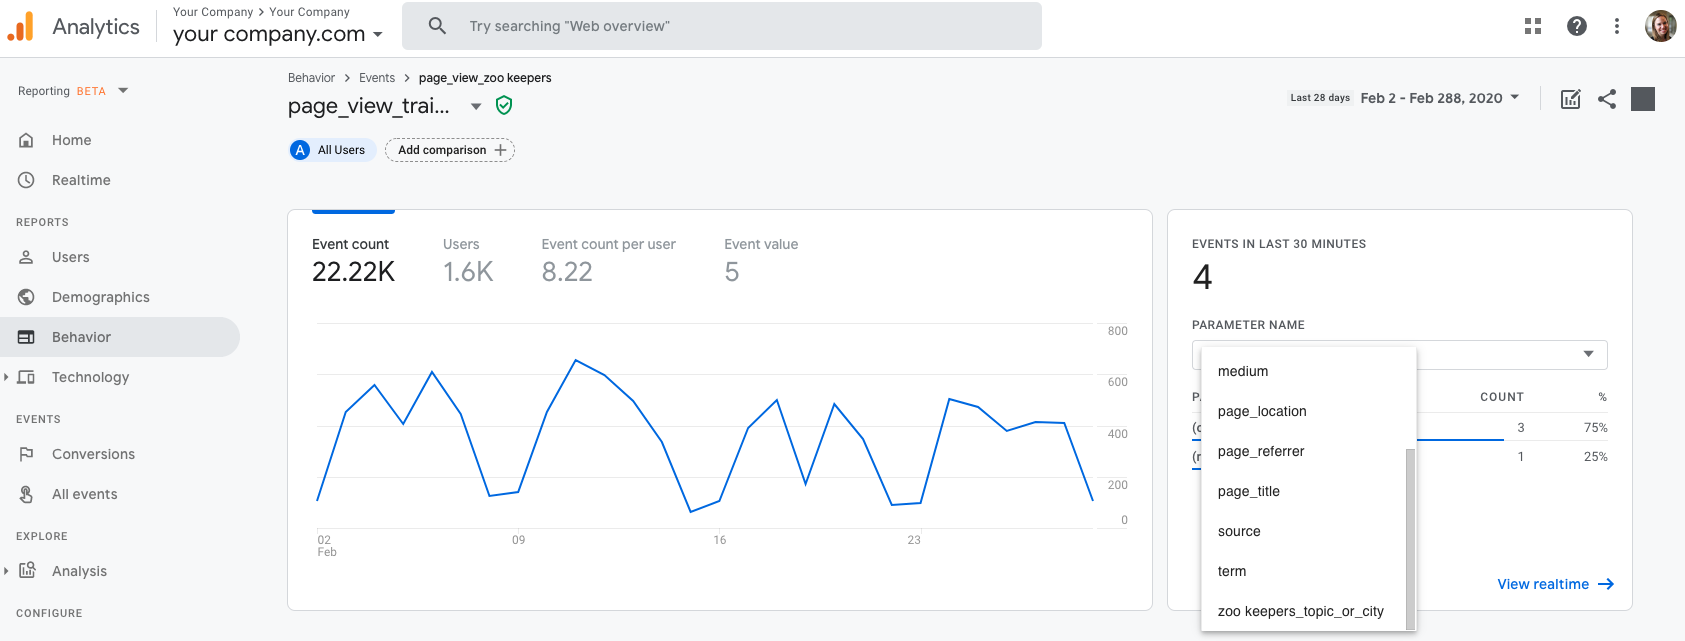
To view your events and associated parameters, simply click on the event name which will open up a specific report for each action. You can interact with the event parameters on the right-hand side via the real-time report, or by scrolling down to see “custom parameter” information.


You can also access this report via the “Behavior” tab, and using the “view events” CTA to drill into the events widget.
Registering events is a significant departure from custom dimensions in Google Analytics, so it is important to strategize and prepare for the event parameters you’d like to register in the interface before exhausting your limits.
For example, parameters that are used for remarketing audiences may be more essential as you’ll export these audiences directly from App + Web into Ads. On the other hand, you can create lookup tables for Product SKU for example in BigQuery, so you may not need the product, height, weight, etc. within App + Web for reporting.
You may have noticed in our previous All Events report screenshot that a few of our events had expansion arrows. This is an indicator that we have registered event parameters to be able to be viewed in the report interface.
In App + Web, you are able to register 50 text parameters and 50 numerical parameters to be shown within the “Parameter Reporting” tab. The most important item to note is that these limits apply per event and per project. Each time a parameter is enabled for a single event, the number of parameters available is reduced.
For example, maybe you want to add a URL as an event parameter for “social_click” and “outbound_link”. While the event parameter is the same (and even named the same in the interface), it will be counted as 2 of 50 text parameters, leaving you with 48 remaining.
To register a parameter, you can hover over the specific event within the interface until you see three dots appear to the right.
From this menu, choose edit parameter reporting, and select the parameters from the left-hand side to be included in your reporting.
Click Save once you’ve added the appropriate parameters to the event. You’ll also be able to see a summary of each event, parameter, and registered totals under the “Parameter Reporting” tab.
To view your events and associated parameters, simply click on the event name which will open up a specific report for each action. You can interact with the event parameters on the right-hand side via the real-time report, or by scrolling down to see “custom parameter” information.
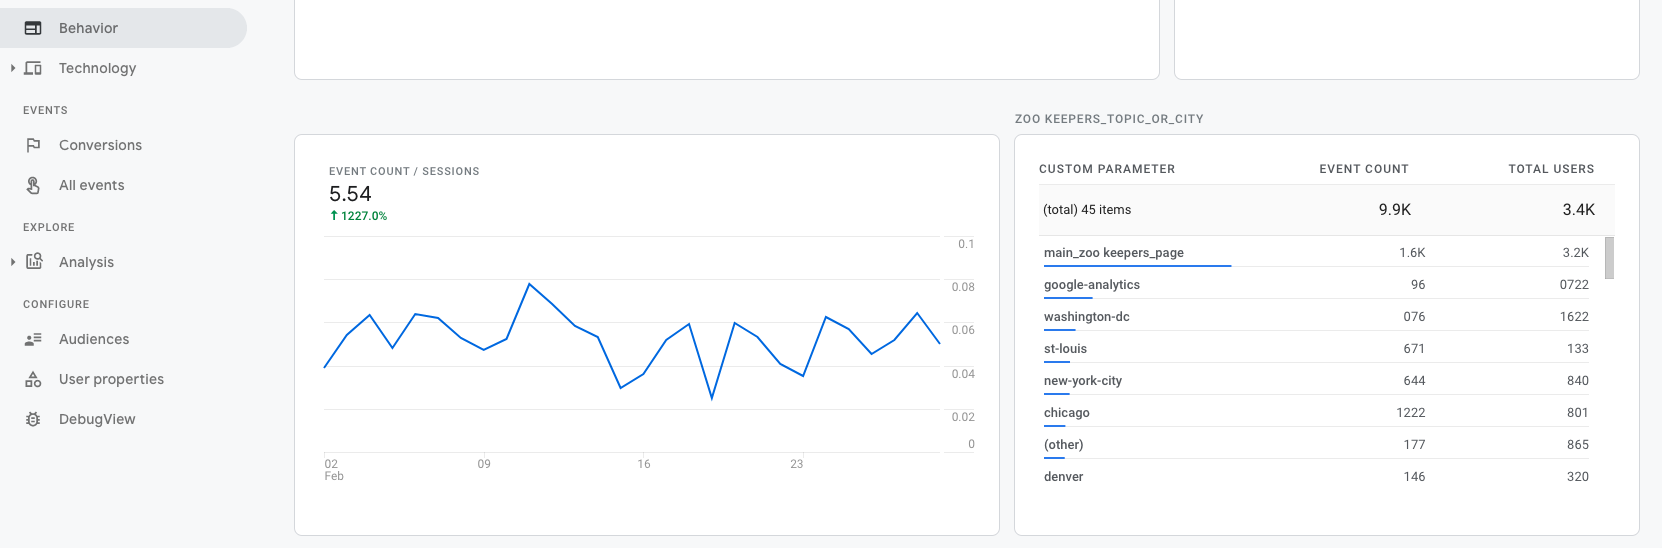
You can also access this report via the “Behavior” tab, and using the “view events” CTA to drill into the events widget.

Registering events is a significant departure from custom dimensions in Google Analytics, so it is important to strategize and prepare for the event parameters you’d like to register in the interface before exhausting your limits.
For example, parameters that are used for remarketing audiences may be more essential as you’ll export these audiences directly from App + Web into Ads. On the other hand, you can create lookup tables for Product SKU for example in BigQuery, so you may not need the product, height, weight, etc. within App + Web for reporting.
Exploring Users in Real-Time
Embracing App + Web isn’t just about utilizing our core reports — Google has also provided us with completely revamped real-time reporting, which enables you to monitor activity on your site or app as it happens.

When might you want to use the real-time reports, other than to be hypnotized by the constantly shifting geo-map? Perhaps your team just launched a new promotion with a limited time span (maybe 24 hours). The real-time reports will enable you to quickly see the impact of this campaign on your traffic, events, and conversions. You can also apply comparisons to your real-time reports to isolate these specific campaigns for speedy insights.
When viewing the real-time reports, it’s important to note that app data from Firebase is usually sent in batches every few minutes to conserve battery life. Because of this, you may notice some delay in your real-time reports when isolating app behavior.
Real-time data collection is also becoming increasingly important to marketers. We expect that these features will only become more advanced as App + Web grows, so be sure to check back often to see what new opportunities are available on a regular basis!
Embracing App + Web isn’t just about utilizing our core reports — Google has also provided us with completely revamped real-time reporting, which enables you to monitor activity on your site or app as it happens.
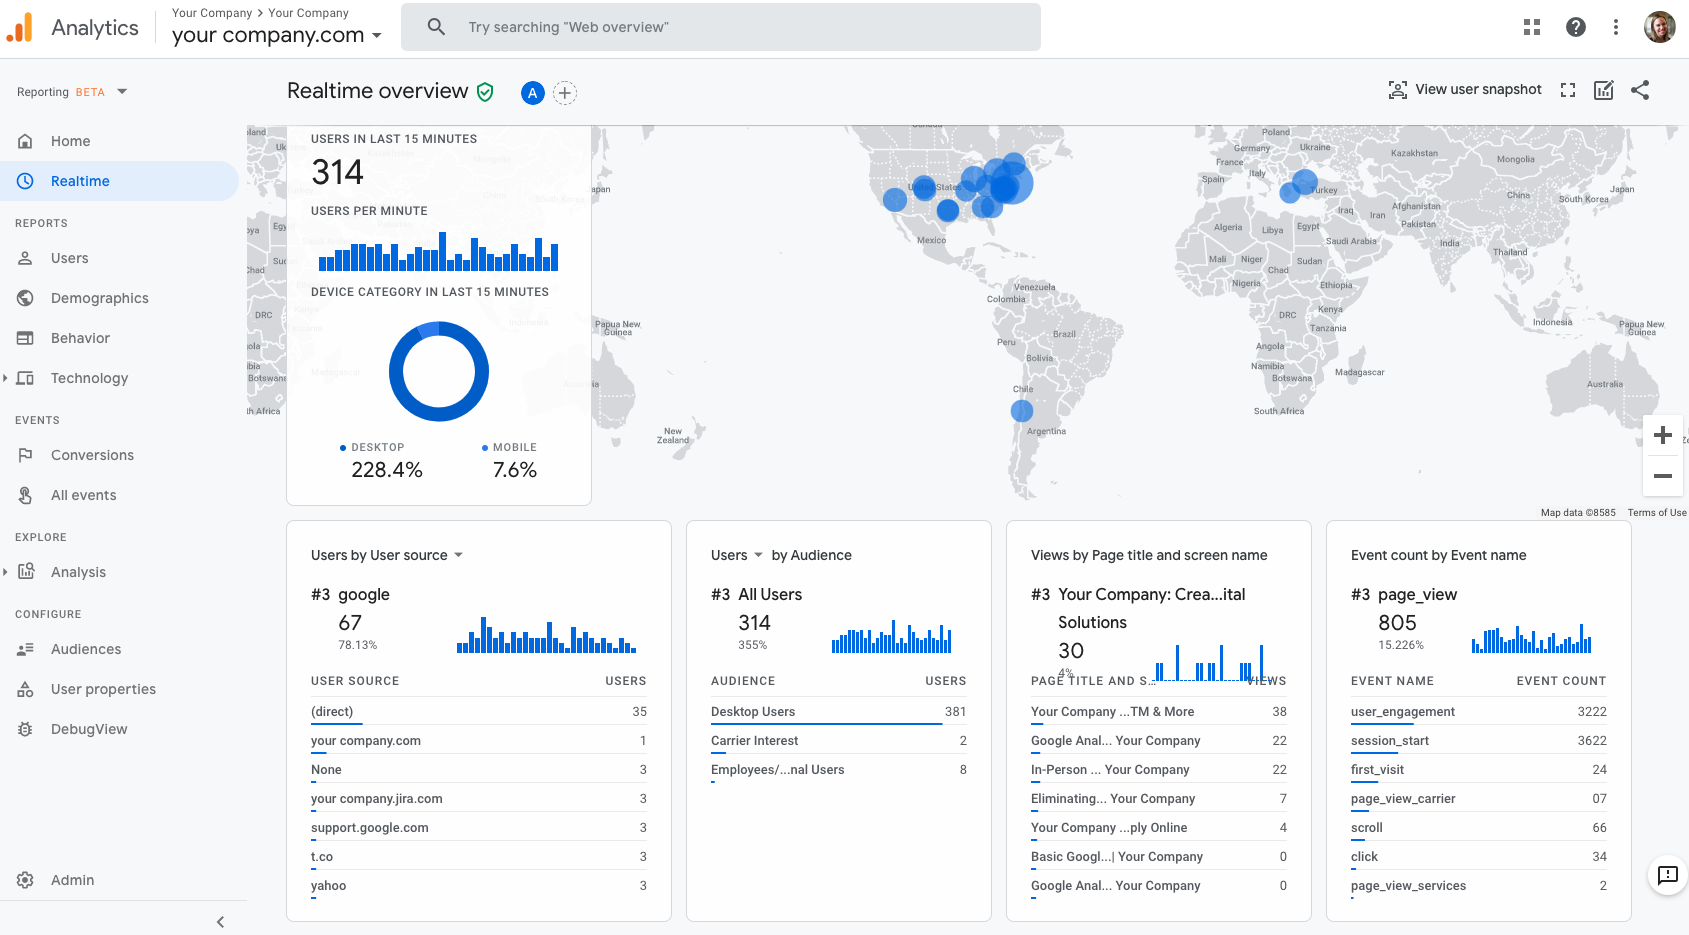
When might you want to use the real-time reports, other than to be hypnotized by the constantly shifting geo-map? Perhaps your team just launched a new promotion with a limited time span (maybe 24 hours). The real-time reports will enable you to quickly see the impact of this campaign on your traffic, events, and conversions. You can also apply comparisons to your real-time reports to isolate these specific campaigns for speedy insights.
When viewing the real-time reports, it’s important to note that app data from Firebase is usually sent in batches every few minutes to conserve battery life. Because of this, you may notice some delay in your real-time reports when isolating app behavior.
Real-time data collection is also becoming increasingly important to marketers. We expect that these features will only become more advanced as App + Web grows, so be sure to check back often to see what new opportunities are available on a regular basis!
There’s Always BigQuery!
It’s a running joke in our office, but if you can’t find what you need within the App + Web interface, there’s always BigQuery! Google BigQuery is Google’s cloud data warehousing solution, and is part of the Google Cloud Platform. BigQuery was designed to handle “big data” reporting, analysis, and data science, and can be used to store and integrate many different kinds of data. BigQuery also has native export connectors to Google Analytics and App + Web!
One main advantage of App + Web is that all users of the product will have access to a BigQuery streaming export. This differs from Google Analytics today, where only Google Analytics 360 customers are able to view hit-level data via BigQuery. While the BigQuery export is available at no extra cost, you’ll need to pay for BigQuery usage (queries and data storage). However, these expenses are usually very minimal.
Why go through the extra effort to link your project to BigQuery? Remember, in Google App + Web we collect events with associated parameters. Within the reporting interface, we are required to enable each custom parameter that we want to report on, and are given very strict limits (up to 50 text parameters and 50 number parameters) that can be enabled per event and per project. Given these limits, you are most likely not going to be able to see all of your customized data in the interface reports. Therefore, BigQuery will become your new best friend for capturing the event parameters you are interested in, but also for joining additional data that you were not able to send with your implementation.
Final Thoughts
In general, we find the new reporting opportunities within App + Web to be extremely encouraging. While it may be difficult to shift our thinking from “Audience, Acquisition, Behavior, and Conversion,” App + Web provides us with the opportunity to simplify and streamline our insights.
We love that App + Web provides a unified view of our consumers, and we believe that the simplified event data model will result in greater flexibility when collecting analytics data from both web and mobile application platforms. Moreover, App + Web enables us to spend less time aggregating data from multiple sources, and more time developing relevant reports to make better business decisions. If that isn’t a win, then I don’t know what is!
Source: https://www.bounteous.com/insights/2020/04/01/reporting-google-analytics-app-web/

No comments:
Post a Comment
If you have any doubts or questions, please let us know.