Showing posts with label Logs. Show all posts

January 4, 2021
Estimated Post Reading Time ~

AEM Error Log Parsing with Environment

AEM ERROR log parsing done using Jenkins on a remote host under various environments. In Jenkins, I have used parameterized build plugin and Powershell plugin

Step-01: User Parameters


Step-02: Password Parameter


Step-03: Host parameter


Step-04: Powershell Build Script

[code lang=powershell]

# Stopping the job if it encounters error, ignoring warnings
$ErrorActionPreference = ‘Stop’
$warningPreference = ‘SilentlyContinue’
# Credentials are stored in env and dynamic variables
$SecurePassword = ${ENV:Password} | ConvertTo-SecureString -AsPlainText -Force
$cred = New-Object System.Management.Automation.PSCredential -ArgumentList ${ENV:User}, $SecurePassword
# Parameters
[String]$AEMENVNUM = (${ENV:myhost} | %{ $_.Split(‘,’)[3]; })
[String]$AEMENV = (${ENV:myhost} | %{ $_.Split(‘,’)[2]; })
[String]$HOSTENV = (${ENV:myhost} | %{ $_.Split(‘,’)[1]; })
[String]$ServerName = (${ENV:myhost} | %{ $_.Split(‘,’)[0]; })
# Logic to parse the error log
[ScriptBlock]$SDScriptBlock = {
param($AEMENV,$ServerName,$HOSTENV,$AEMENVNUM)
write-output “Executing ErrorLogParsing on HOST Environment=${HOSTENV}, AEM Environment=${AEMENV}, AEM Instance Number=${AEMENVNUM}”
$PATH = “C:\Users\SKYDEVOPS\Desktop\testenv\${AEMENV}\logs\error.log”
$OUTPATH = “C:\Users\SKYDEVOPS\Desktop\backups\”
$TIMESTAMP = $(get-date -f yyyy_MM_dd_hhmmss)
$REGEX = “^.*\*\b(ERROR)\b\*.*$”
select-string -Path $PATH -Pattern $REGEX -AllMatches | % { $_.Matches } | % { $_.Value } | % { $_.substring($_.indexOf(‘:’)+19) } | Get-Unique | Group-object | Format-Table -Wrap -AutoSize -Property Count,Group > ${OUTPATH}errorLogFilter-$AEMENV-$TIMESTAMP.log
}
# Invoke a command on the remote machine.
Invoke-Command -ComputerName $ServerName -Credential $cred -ScriptBlock ${SDScriptBlock} -ArgumentList $AEMENV,$ServerName,$HOSTENV,$AEMENVNUM
[/code]

Step-05: Console Output


Step-06: Parsed Log Output


By aem4beginner

AEM Log Rotation Powershell

Following is the PowerShell script to rotate logs depending on the retention policy.

[code lang=powershell]
$DAYS_TO_DELETE=”-2″
$CurrentDate = Get-Date
$TIMESTAMP=$(get-date -f yyyy_MM_dd_hhmmss)
$DatetoDelete = $CurrentDate.AddDays($DAYS_TO_DELETE)
$LOGPATH=”C:\Users\SKYDEVOPS\Desktop\logs”
$BACKUP_PATH=”C:\Users\SKYDEVOPS\Desktop\backups\”
$ARCHIVEPATH=”${BACKUP_PATH}archive_$TIMESTAMP”;

if ((Test-Path -path $BACKUP_PATH)) {
mkdir $ARCHIVEPATH > $null
}
else {
Write-Output “Backup Directory Not Found”
}

if ((Test-Path -path $LOGPATH)) {
echo ” ”
Write-Output “AEM logs Found, compressing and rotating logs”
}
else {
echo ” ”
Write-Output “AEM logs not found, Exiting”
Exit
}

# Moving logs to the archive directory
Get-ChildItem -Path $LOGPATH -Exclude “upgrade.log”, “startup.log”, “request.log”, “error.log”, “history.log”, “access.log”, “audit*.log” | Where-Object { $_.LastWriteTime -lt $DatetoDelete } | Move-Item -Destination “$ARCHIVEPATH”

# Compressing
compress-archive -Path $ARCHIVEPATH -CompressionLevel optimal -DestinationPath “${BACKUP_PATH}archive_$TIMESTAMP.zip”
Remove-Item -Path $ARCHIVEPATH -Recurse
[/code]


By aem4beginner

Changing Log Levels in AEM

SYNOPSIS:
Changing the Logging level in AEM for many reasons, this guide will give you a basic overview of how to change the LOG Level in AEM. Some of the parameters which can be tweaked are mentioned below. No restart required.
Log Level and Log File, to define the location and log level of the central logging configuration (error.log). The level can be set to one of DEBUG, INFO, WARN, ERROR, and FATAL.
A number of Log Files and Log File Threshold to define the size and version rotation of the log file.
Message Pattern defines the format of the log messages.

GUIDE:
STEP-01: Go to AEM OSGI configuration Manager, or directly navigate to slinglog to check the different log configurations.

STEP-02: Click on the wrench icon to edit the respective log configuration, for example, error.log, which will take you to edit the sling logging configuration for error.log

STEP-03: Select the appropriate logging level and SAVE the configuration

STEP-04: Verify the logging level has been changed by checking the error log


DONE.


By aem4beginner

How to access all AEM logs via Felix Console

Sometimes, we need to get all AEM logs but might not have SSH access to the server.
In such scenarios, we can rely on the Felix Console.

1) Go to <domain>/system/console/status-slinglogs


The screen rolls automatically when the log files get updated for the current day.
However, all log files can also be downloaded via 4 options:

1) Download As Text
This will open a text document: <domain>/system/console/status-slinglogs.txt that has content from all log files

2) Download As zip
This will download a zip file named 'status-slinglogs.zip' on your machine.
All system and custom log files can be extracted from this zip file.


3) Download Full Text
This will open a text document: <domain>/system/console/status-slinglogs/configuration-status-<date>.txt that has information about all bundles and content from all log files

4) Download Full Zip
This will download a zip file named 'configuration-status-20170503-050248.zip' on your machine.
All bundle details, config details, and log files can be extracted from this zip file.


By aem4beginner

January 2, 2021
Estimated Post Reading Time ~

How to Package AEM Log Files

The following are the steps in packaging the complete AEM log files. This is extremely helpful when opening a DayCare ticket for issues with Adobe or when trying to collaborate with other teams. AEM log files are located within the AEM folder on the server. Location of AEM Logs will be “<aem-installation-dir>/crx-quickstart/logs”.

Using this process, you will zip the following base logs as well as other custom log files that you have configured:

access.log
- All access requests to AEM and the repository are registered here
audit.log - Moderation actions are registered here
error.log - Error messages (of varying levels of severity) are registered here
history.log - Provides revision journaling information
request.log - Each access request is registered here together with the response
upgrade.log - Provides a log of all upgrade operations and tasks

Technical Steps:
1. From the operations Dashboard, click on Web Console


2. Click on Status > Log Files


3. Click on Download as Zip to package and download the file:


By aem4beginner

ACS AEM Commons Audit Log Search

On a recent project, we had some issues around go-live where production content was being overwritten, deleted, or changed. We needed to figure out what was causing these

issues quickly, as this was affecting author productivity and could potentially cause content issues if the wrong content went live.

At the time, we used queries in CRXDELite to search the AEM Audit Log for events to diagnose the issue, however, I felt like there had to be some better way. Surprisingly, AEM does not include a way to search the Audit Log in a GUI.

Donating to ACS AEM Commons
Since this was clearly a need, I created an Audit Log search console and donated it to the ACS AEM Commons project, an Open Source collection of tools and utilities for the AEM platform maintained by Adobe.

The Audit Log Search console was accepted and is now available in ACS AEM Commons version 3.7.0 and newer for AEM 6.2 and version 2.10.0 and newer for AEM 6.0.

Using Audit Log Search

To use the Audit Log Search:
Download AEM ACS Commons version 3.7.0 or later if you are using AEM 6.2+ or version 2.10.0 if you are using AEM 6.0 or 6.1
Navigate to /etc/acs-commons/audit-log-search.html on your environment
Enter your search parameters
Click the Search Audit Log button

This will perform the search and return the results in the table below.


You can read more on the ACS AEM Commons website. Hopefully, this helps you more easily track down who changed what and when in your AEM instance.


By aem4beginner

Customized Logging using SLF4J / MDC in AEM

Out of the box, AEM provides a pattern-based logging system that comes pre-configured with a MessageFormat pattern for logging. This is a somewhat legacy messaging format, which, for most applications, has been updated with a “Logback” implementation. The main reason for said replacement is the flexibility that logs back techniques can offer, including a more customized log pattern support, in addition to the ability to add in mapped variables, or in log back terminology, Mapped Diagnostic Context, or MDC. 

AEM comes bundled with SLF4J, and therefore already has support for log back patterns, and more importantly, MDC. What is missing here is how to populate the variable which needs to be logged on each request, and how to manipulate your logging patterns to accommodate said variable.

Step 1: Create a Sling Filter
To utilize MDC, there are two main steps:
  • Populating the MDC Object (Map)
  • Referencing the MDC Properties (Logging Pattern)
In AEM, every request flows through a filter chain, meaning we need to populate the MDC variable early enough in the filter that we can successfully log those variables later. The easiest way to do this is to set the scope of a custom filter to be at the request level, order 0:

/**
* The SlingFilterScope.REQUEST is important as MDC needs to be configured prior
* to any logger being executed in the page rendering.
*/
@SlingFilter(
label = "Sample MDC Filter",
description = "Sample implementation of custom MDC properties.",
order = 0,
scope = SlingFilterScope.REQUEST)


Then you need to import the MDC object into your class:
import org.slf4j.MDC;

The rest of the logic is up to you! The request object gives you direct access to the following:
  • ResourceResolver (Access to JCR)
  • Request Headers
    • You can use a RequestWrapper to customize
  • Request Cookies
  • Request Parameters
And of course, you can always use a customized service user for more targeted JCR access. For sake of simplicity, this example includes logic to read a request parameter named “appId”.

public void doFilter(ServletRequest servletRequest, ServletResponse servletResponse,
FilterChain filterChain) throws IOException, ServletException {
final SlingHttpServletRequest request = (SlingHttpServletRequest) servletRequest;
try {
insertIntoMDC(request);
filterChain.doFilter(request, servletResponse);
} finally {
clearMDC();
}
}
private void clearMDC() {
for (String key : MDC_CUSTOM_KEYS) {
MDC.remove(key);
}
}
private void insertIntoMDC(SlingHttpServletRequest request) {
//logic can go here to take value from request object.
// Can also utilize ResourceResolver from same request.
// If needed, can also write a generic OSGi Configuration
// (String Array Properties) to read from standard request objects,
// i.e cookies, headers, and parameters.
MDC.put(APPLICATION_ID,request.getParameter(APPLICATION_ID));
}

That is it! Deploy the filter and we will have (the ability) to log a passed in request parameter into your log.

Here’s the full class for those copy/pasters:
package com.perficient.commons.core.filters;
import org.apache.felix.scr.annotations.sling.SlingFilter;
import org.apache.felix.scr.annotations.sling.SlingFilterScope;
import org.apache.sling.api.SlingHttpServletRequest;
import org.slf4j.MDC;
import javax.servlet.FilterChain;
import javax.servlet.FilterConfig;
import javax.servlet.ServletException;
import javax.servlet.ServletRequest;
import javax.servlet.ServletResponse;
import java.io.IOException;
/**
* The SlingFilterScope.REQUEST is important as MDC needs to be configured prior
* to any logger being executed in the page rendering.
*/
@SlingFilter(
label = "Sample MDC Filter",
description = "Sample implementation of custom MDC properties.",
order = 0,
scope = SlingFilterScope.REQUEST)
public class MDCLoggerFilter implements javax.servlet.Filter{
public static final String APPLICATION_ID = "appId";
private static final String[] MDC_CUSTOM_KEYS = {
APPLICATION_ID,
};
public void init(FilterConfig filterConfig) throws ServletException {
}
public void doFilter(ServletRequest servletRequest, ServletResponse servletResponse,
FilterChain filterChain) throws IOException, ServletException {
final SlingHttpServletRequest request = (SlingHttpServletRequest) servletRequest;
try {
insertIntoMDC(request);
filterChain.doFilter(request, servletResponse);
} finally {
clearMDC();
}
}
private void clearMDC() {
for (String key : MDC_CUSTOM_KEYS) {
MDC.remove(key);
}
}
private void insertIntoMDC(SlingHttpServletRequest request) {
//logic can go here to take value from request object.
// Can also utilize ResourceResolver from same request.
// If needed, can also write a generic OSGi Configuration
// (String Array Properties) to read from standard request objects,
// i.e cookies, headers, and parameters.
MDC.put(APPLICATION_ID,request.getParameter(APPLICATION_ID));
}
public void destroy() {
}
}

Step 2: Updating the Logging Pattern
This step actually helped uncover an issue in the latest AEM versions. At the time of writing, AEM “Logging Logger Configurations” do not properly leverage the “Apache Sling Logging Logger” pattern variable. Instead, it references the “default” pattern, found in the configuration for org.apache.sling.commons.log.LogManager. As a work-around, we will update the “default” LogManager instead of updating the application-specific “Logging Logger” pattern. You can perform this update directly in AEM:


Or, my recommendation, create an associated OSGi configuration within your code repository’s associated config folder ( /apps/<project>/config) named org.apache.sling.commons.log.LogManager.xml with the following contents:

<?xml version="1.0" encoding="UTF-8"?>
<jcr:root xmlns:sling="http://sling.apache.org/jcr/sling/1.0" xmlns:cq="http://www.day.com/jcr/cq/1.0" xmlns:jcr="http://www.jcp.org/jcr/1.0" xmlns:nt="http://www.jcp.org/jcr/nt/1.0"
jcr:primaryType="sling:OsgiConfig"
org.apache.sling.commons.log.pattern="%d{dd.MM.yyyy HH:mm:ss.SSS} *%level* [%X{appId:-NoAppId}] [%thread] %logger %msg %ex%n"
org.apache.sling.commons.log.file.size="'.'yyyy-MM-dd"
org.apache.sling.commons.log.file="logs/error.log"
org.apache.sling.commons.log.file.number="7"
org.apache.sling.commons.log.level="info"
org.apache.sling.commons.log.maxOldFileCountInDump="3"
org.apache.sling.commons.log.numOfLines="10000"
org.apache.sling.commons.log.maxCallerDataDepth="7"
org.apache.sling.commons.log.packagingDataEnabled="{Boolean}false"/>


You will notice that in the above example I use a different format for the pattern string. One that may look more familiar is the default MessagePattern format:

{0,date,yyyy-MM-dd HH:mm:ss.SSS} {4} [{3}] {5}

In this default pattern, each number corresponds with a given data point, as described in the official docs. In our case, you see variables prefixed with a percentage sign. Odd! Well, fortunately, there is also a mapping for these, which we can also map using the official logback documentation.

The most interesting of the group is the %X variable. This is what exposes your custom MDC variables. In the above example, %X{appId:-NoAppID}” defines a placeholder for a property named “appId” as well as its default text, “NoAppId”. The standard for supplying defaults for any MDC object is to use the “:-” delimiter followed by the default text. Therefore, %X{appId} would output an empty string if null, whereas %X{appId:-NoAppId} would output “NoAppId” if null.

Similarly, to output, all of the configured MDC variables, simply do not specify the variable you want to output: %X. If configured this way, the entire MDC map would be output as a comma-separated list.

For a much deeper look at all possible variable mappings, I would highly suggest taking a look at the official logback documentation, which I will link to again here: https://logback.qos.ch/manual/layouts.html#conversionWord

Step 3: Check out the results
Once you’ve pushed the updated configuration and your custom sling filter, the changes should be active! If you followed the exact steps above, you’ll see a lot of “NoAppID” messages. Do not fret – this is because we never requested a page with the “appId” request parameter. For example, a simple we-retail request ( http://localhost:4502/content/we-retail/ca/en/experience.html ) should result in:

24.09.2018 12:41:36.819 *WARN* [NoAppId] [0:0:0:0:0:0:0:1 [1537818095824] GET /content/we-retail/ca/en/experience.html HTTP/1.1] com.adobe.granite.ui.clientlibs.impl.HtmlLibraryManagerImpl No library configured at /etc/designs/we-retail
24.09.2018 12:41:36.915 *INFO* [NoAppId] [0:0:0:0:0:0:0:1 [1537818095824] GET /content/we-retail/ca/en/experience.html HTTP/1.1] com.day.cq.wcm.core.impl.designer.SystemDesign Initialized system design at /etc/designs/default in 13ms
24.09.2018 12:41:38.432 *WARN* [NoAppId] [0:0:0:0:0:0:0:1 [1537818095824] GET /content/we-retail/ca/en/experience.html HTTP/1.1] com.adobe.granite.ui.clientlibs.impl.HtmlLibraryManagerImpl No library configured at /apps/clientlibs/granite/jquery-ui
24.09.2018 12:41:40.303 *INFO* [NoAppId] [0:0:0:0:0:0:0:1 [1537818100301] GET /home/users/Z/ZxNe0kWWedMwcd2ZAFhp.infinity.json HTTP/1.1] org.apache.sling.engine.impl.SlingRequestProcessorImpl service: Resource /home/users/Z/ZxNe0kWWedMwcd2ZAFhp.infinity.json not found

However, if we change the URL to add our appId, http://localhost:4502/content/we-retail/ca/en/experience.html?kp.appId=RMAPP, we get the following:

24.09.2018 12:43:39.305 *WARN* [RMAPP] [0:0:0:0:0:0:0:1 [1537818219292] GET /content/we-retail/ca/en/experience.html HTTP/1.1] com.adobe.granite.ui.clientlibs.impl.HtmlLibraryManagerImpl No library configured at /apps/clientlibs/granite/jquery-ui
24.09.2018 12:43:39.305 *WARN* [RMAPP] [0:0:0:0:0:0:0:1 [1537818219292] GET /content/we-retail/ca/en/experience.html HTTP/1.1] com.adobe.granite.ui.clientlibs.impl.HtmlLibraryManagerImpl No library configured at /etc/cloudsettings/default/contexthub.kernel
24.09.2018 12:43:39.309 *WARN* [RMAPP] [0:0:0:0:0:0:0:1 [1537818219292] GET /content/we-retail/ca/en/experience.html HTTP/1.1] com.adobe.granite.ui.clientlibs.impl.HtmlLibraryManagerImpl No library configured at /etc/designs/we-retail
24.09.2018 12:43:39.436 *WARN* [RMAPP] [0:0:0:0:0:0:0:1 [1537818219292] GET /content/we-retail/ca/en/experience.html HTTP/1.1] com.adobe.granite.ui.clientlibs.impl.HtmlLibraryManagerImpl No library configured at /apps/clientlibs/granite/jquery-ui


Obviously, the true power of these entries will show when leveraging JCR and the Resource Resolver. Potentially a topic for another day. Have fun and good luck tinkering!
Kudos

I want to give appropriate recognition to the initial implementation in which this was derived: https://github.com/chetanmeh/sling-logback. Unfortunately, this package no longer functions without modification on a 6.3 instance. The logic for setting OSGi configuration properties for header, cookie, and parameters could be mirrored in this example if desired.

Source:


By aem4beginner

Log Tailer Plus: A Client-Side Log Tailer for AEM

In the past, while working on client engagements, the simple task of viewing the logs has been problematic. Without system access, analyzing AEM logs in real-time on a non-local environment is almost impossible using the provided AEM tools. This is because the out of the box client-side logging with AEM is a reflection of the plain text logs on the system. However, those who have viewed logs directly on their system typically leverage other software to view log files. On the client-side, unfortunately, there are no such applications available out of the box with AEM. Log Tailer Plus was created to fill that void – providing a client-side application for viewing logs within AEM.

As a reminder, here is a screenshot of two different log consoles found in AEM out of the box:

/system/console/slinglog/tailer.txt


CRX/DE Logger (actually uses tailer.txt under the hood)


A New Challenger has Appeared
Log Tailer Plus solves the above problem and allows users to view the AEM Logs without the need for system-level permissions. Because it is built around the existing /system/console/slinglog/tailer.txt servlet, it already included (server-side) support for leveraging the sling configurations appenders. On top of the existing functionality, Log Tailer Plus includes additional client-side functionality in order to display the data in a much more consumable format.
Features

Standard Message Format Highlighting / Hover


Coming Soon: User/Custom highlight rules
Multiple Logs in the Same Window


Add Log Form Control


Note: Each logger currently requires 600px width. Only enormous screens will support more than three concurrent loggers in the same window.

Pin/Follow Toggle


Clear Log, Advanced Settings, Remove Tailer


Advanced Settings Dialog


Stack trace collapsing


Look! The stack trace disappears!

Installation
Requirements:

AEM 6.2+

Notes:
Do not install Log Tailer Plus in production deployments. Exposing your logs can be a security risk.

Steps:
To install, simply download and install the provided AEM package, or build it yourself from the source (see below for links). The tool installs to /apps/log-tailer-plus and is completely self-contained. Once installed, access the Log Tailer Plus by navigating to the pre-configured vanity URL /log-tailer-plus. The top-level apps page is also directly accessible: /apps/log-tailer-plus.html.

Download/More Information
For more information about the project, visit the projects:
  1. Github Repository.
  2. Releases


By aem4beginner

December 28, 2020
Estimated Post Reading Time ~

Basic Steps to Debug an Error in AEM

There are times when something is not working as expected from the AEM Server; relax, you are fine. The error can be quickly identified through debugging on the server with a series of steps. Once the error has been identified you can attempt to solve the error efficiently. In this article, I will share with you the basic steps I take to quickly debug an error in AEM; following the order (in steps) will help you optimize and identify the problem quickly.

Common issues you may be experiencing can be:
  • Replication is not replicating properly.
  • The rendered page is missing a component.
  • The rendered page is blank.
  • Servlet is not registered.
  • etc…


1. Analyse Browser’s Console
When there’s an issue, be sure to take a look at the browser’s console log as the first action to take. The console log can show you errors that may help you pinpoint the error immediately, before looking at server logs.

The errors might be a third-party JavaScript library or from an external RESTFUl micro-service that is not related to AEM at all…

2. Analyse error.log
If the Browser’s console log has no relevant information, we can go ahead to review the error.log; this file can be found from ./crx-quickstart/logs/error.log.

The error.log catches exceptions that are output into the log file. Typically the logs in this file can help you quickly pinpoint the error. Whether the error will be from a bundle by your organization, a bundle from the AEM product, or even a missing configuration, the logs will expose this information.

3. Analyse <custom>.log
When the error.log does not show you the relevant information you can take a look at your custom log files that exist in ./crx-quickstart/logs/*. The custom log files will be able to help you pinpoint your error.


By aem4beginner

October 1, 2020
Estimated Post Reading Time ~

AEM Log Tracer: Chrome Plugin


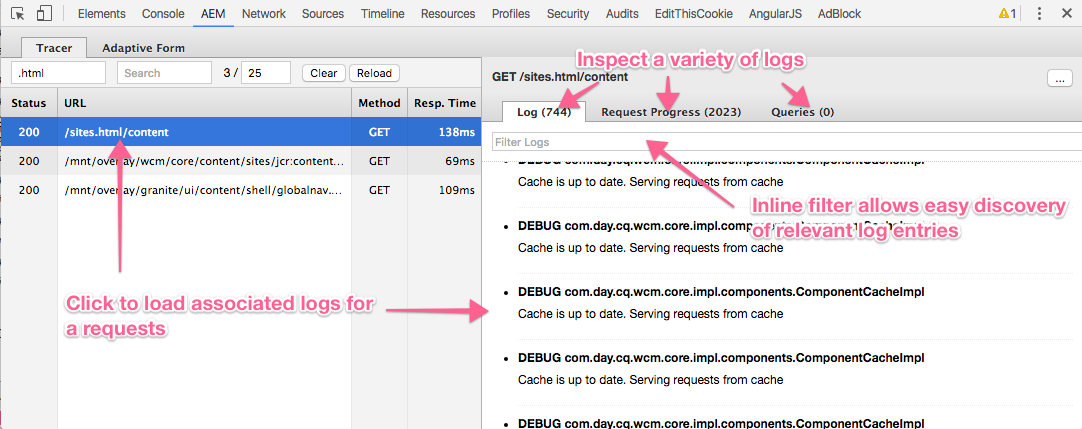
AEM Log Tracer is a Chrome browser extension that exposes server-side log information per-request in the browser.

AEM Log Tracer collects and exposes per-request:
AEM Logs
Request Progress
Queries executed
Below are the steps to use Log Tracer

Download and install Sling Log Tracer 1.0.2+ via AEM 6.0+ Felix Console and ensure it is started/active.
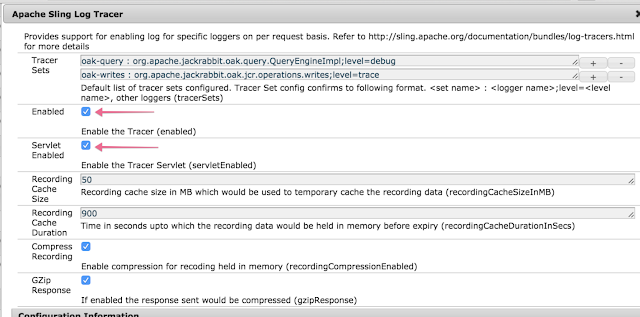
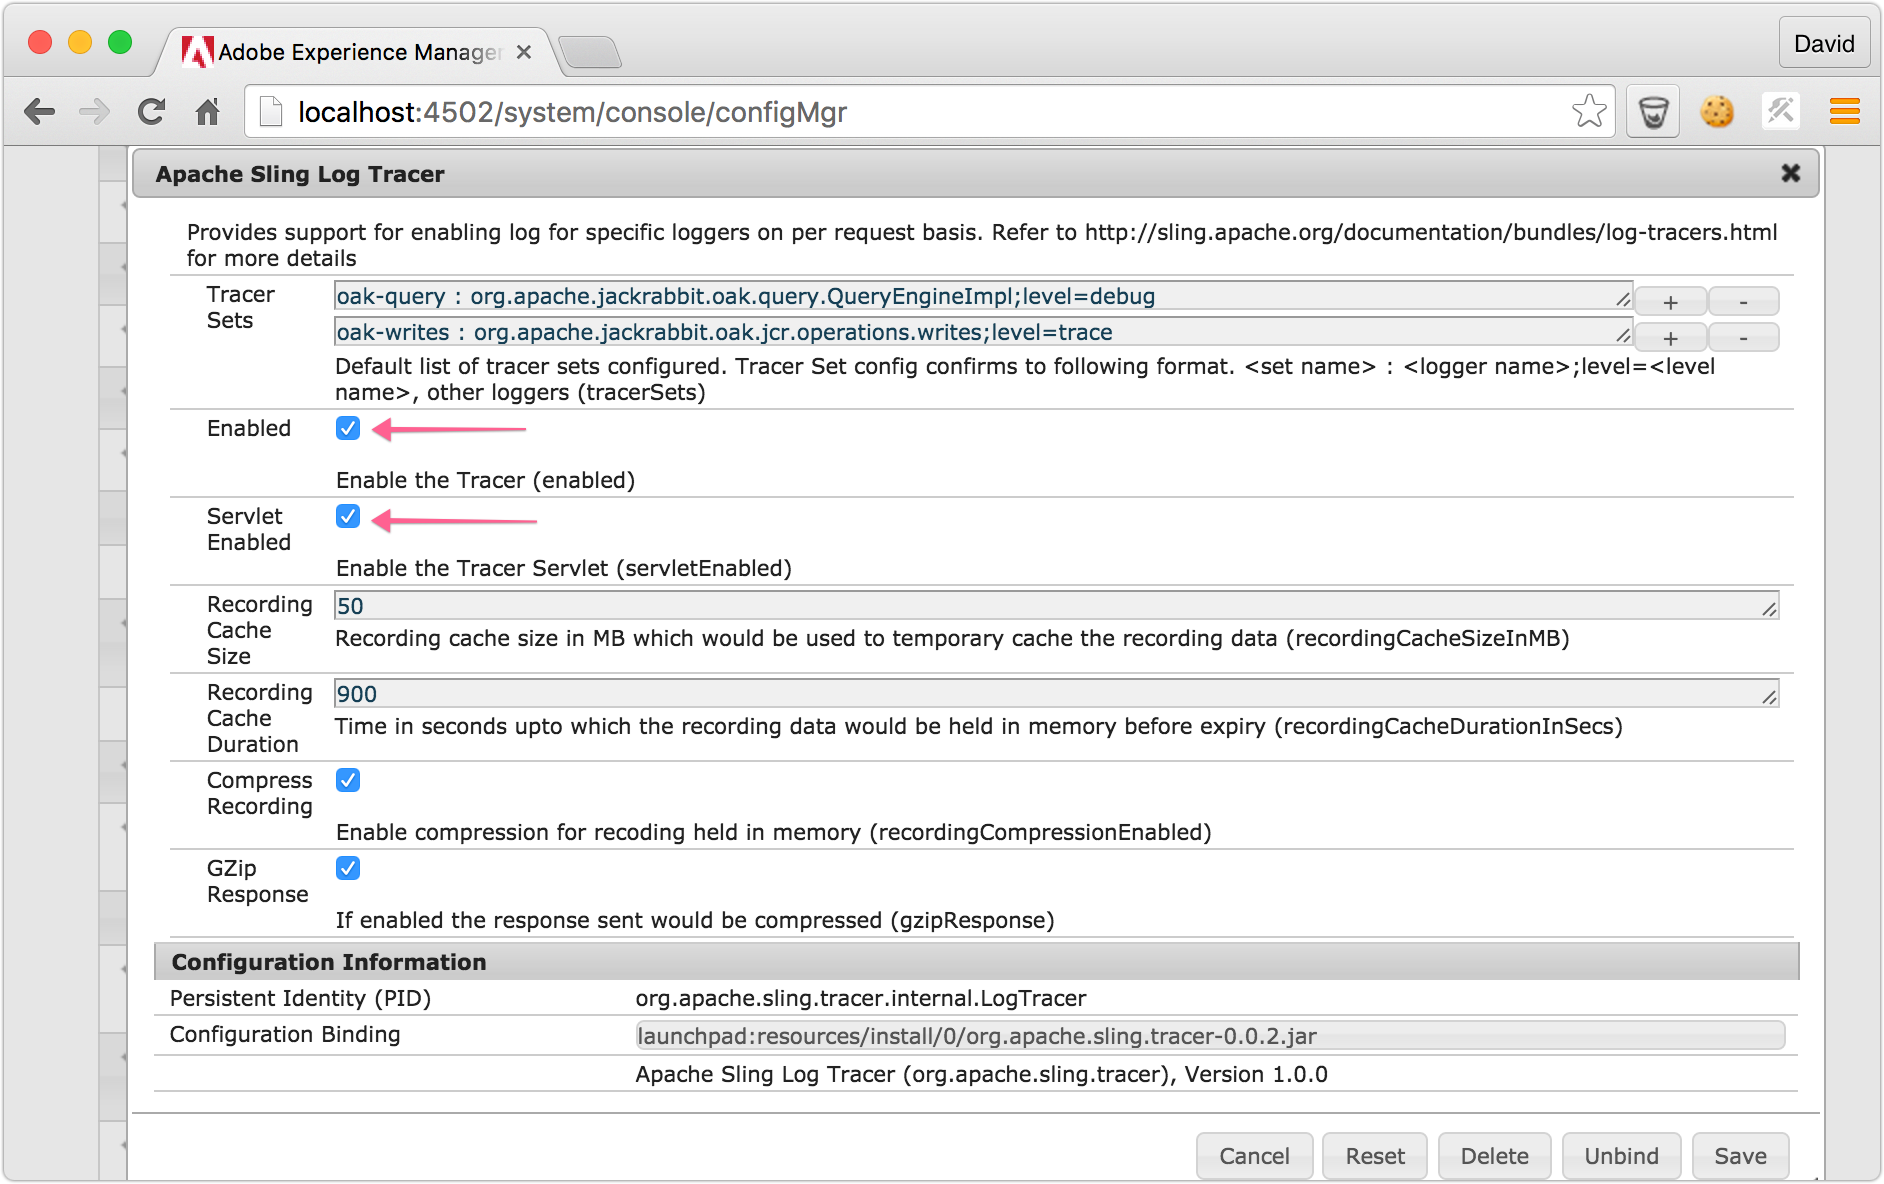
Enable Sling Log Tracer via Felix ConfigMgr.
Install the AEM Chrome Plug-in via the Chrome web store.
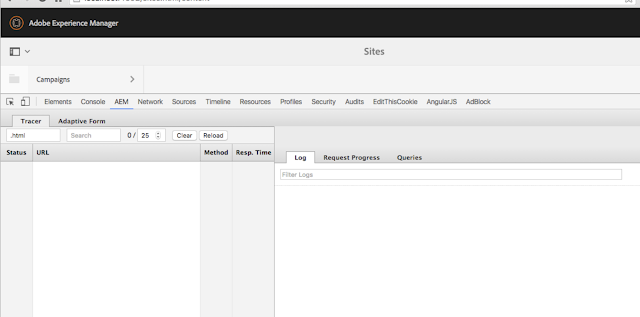
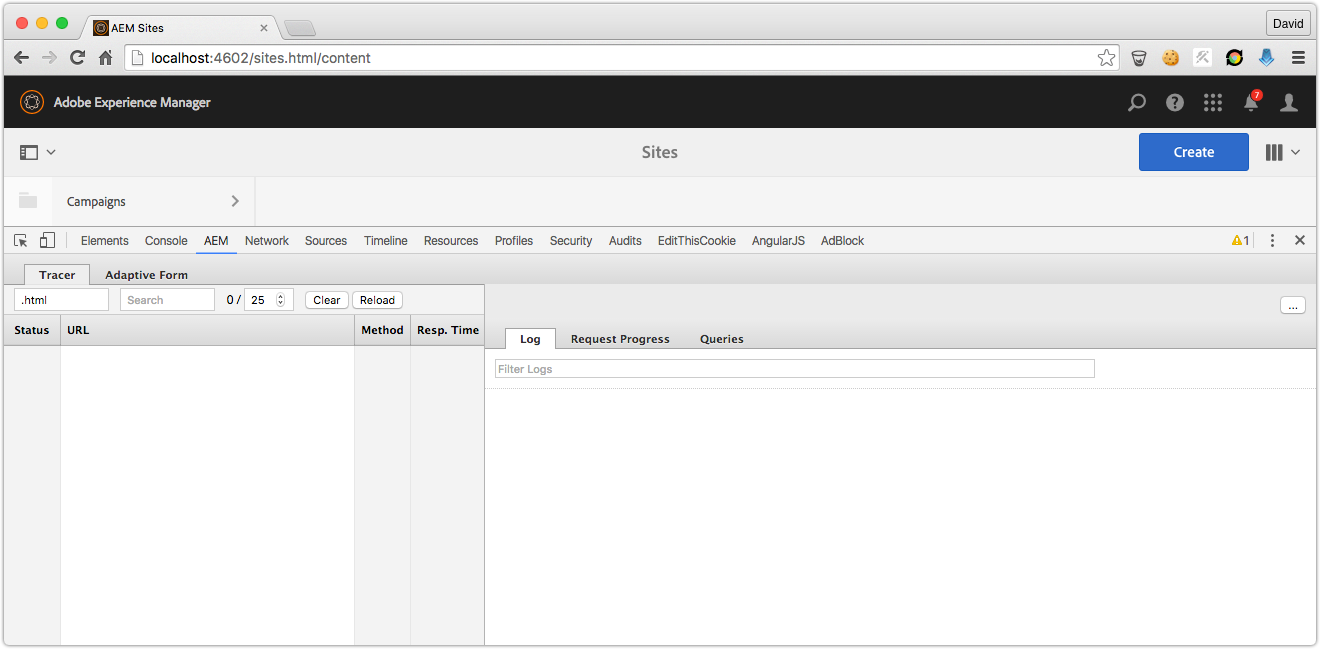
Open up Chrome Dev Panels (Chrome > View > Developer > Dev Tools) and click on the AEM tab.


Click here to see more info.


By aem4beginner

May 21, 2020
Estimated Post Reading Time ~

Debug/Info Logging for a Particular Java Class in Adobe CQ 5

In Adobe CQ5, it sometimes becomes necessary to make a particular package or class spit out DEBUG level log entries in order to troubleshoot problems.

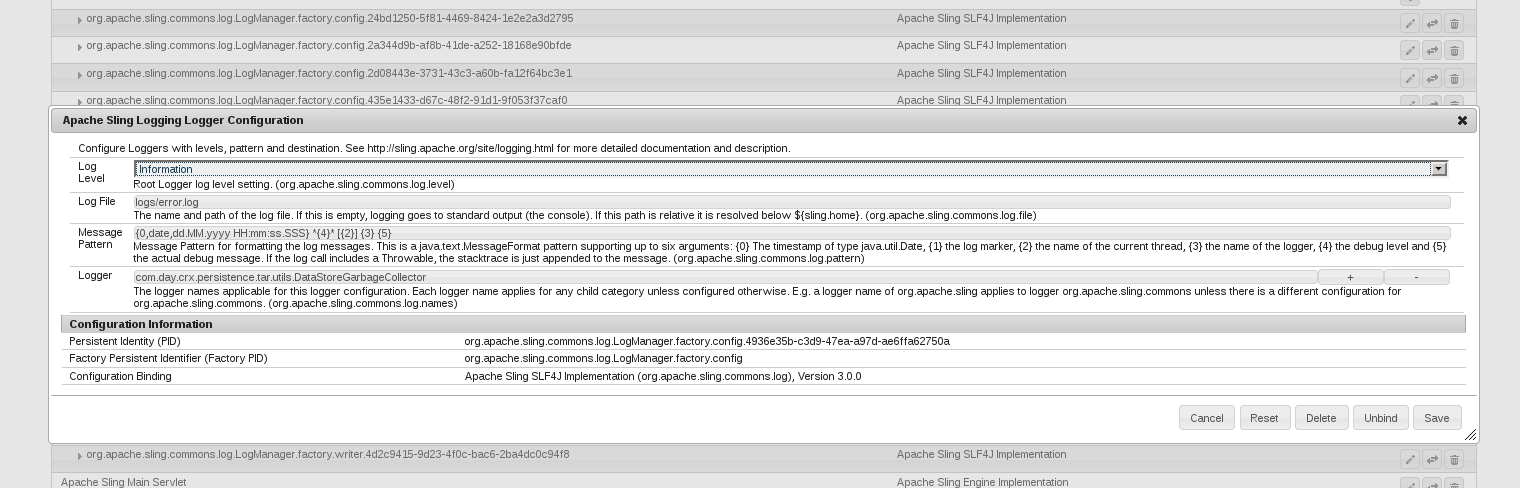
1) From the error.log, determine the class that you want to bump up logging on. I.e. let’s say you’ve got system logging turned up to Warn and you want to see the INFO level progress of your datastore Garbage Collection (com.day.crx.persistence.tar.utils.DataStoreGarbageCollector)

2) Add an INFO logger configuration for that class.

In the OSGi configuration console at /system/console/configMgr, search for “Apache Sling Logger Configuration” and click the plus sign to its right. The class name should be in the field labeled “Logger”. See the example below.


By aem4beginner

May 19, 2020
Estimated Post Reading Time ~

4 Ways Sling Logging Makes You a Better Developer

Logging is a critical component of developing stable and secure applications. When used correctly, logs can provide insight into application topics like security, performance, debugging, and more. In Adobe Experience Manager (AEM), you can leverage Sling Logging to diagnose salient issues, like slow loading times and component or page load failures. If you are familiar with Log4j or Simple Logging Facade for Java (SLF4J), your experience will accelerate your understanding of Sling Logging within AEM.

Here are four tips that show the usefulness and flexibility of Sling Logging:

1. Acquiring and Using a Logger Instance
AEM includes the org.apache.sling.commons.log bundle with an implementation of SLF4J. The SLF4J framework allows you to interact with the logging system in AEM. You can easily acquire a SLF4J Logger instance in your own class via the LoggerFactory:

Which will produce output similar to the following in the logs/error.log file:

2. Using the Groovy SLF4J Annotation
If you are developing with Groovy, you can use the @Slf4j annotation to automatically set up an org.slf4j.Logger log object. You won’t have to manually set up a Logger from the LoggerFactory and your fully qualified class name will already be associated with the log object. Ultimately, this will give you the same type of Logger instance as the previous example, but with less boilerplate code involved.
Here is an example:
Which will produce output similar to the following in the logs/error.log file:

3. AEM Logs Default Output File
You might be wondering why the previous examples info and error log events both output to the logs/error.log file and what configuration controls this. There is a Sling Log Support configuration page where loggers can be created and edited with the following properties:
  • Log Level: The broadest log level the logger will respond to.
  • Additive: Controls whether logged events are forwarded to parent loggers.
  • Log File: Relative path to a file where log statements will be appended.
  • Logger: An identifier/label for the logger.
Any Logger instance that you create that has no existing logger configuration will be interpreted as a child of the default ROOT logger. All logging statements produced by the child logger will be forwarded to the parent logger, using its configuration instead. The ROOT logger outputs to logs/error.log by default, so this is why your Logger instance statements end up in logs/error.log.

You might notice the other loggers that exist on your instance by default, like log.history. This logger tracks when AEM users view or modify pages and assets and outputs these events to logs/history.log.

If you wanted to look into this logger and append log statements to logs/history.log, you would want to specify the logger identifier log.history when grabbing a Logger instance from the LoggerFactory.

Here is an example:
Which will produce output similar to the following in the logs/history.log file:

4. Log Tail Endpoint
The Sling Log Support page in the AEM Web Console reveals another useful feature for viewing logs remotely.

You will need to provide request parameters to specify what log contents you want to see:
  • name: URL encoded relative path to the desired log file. Example: %2Flogs%2Ferror.log
  • tail: Number of lines to display, starting at the end of the file.
  • grep: Option to filter out the results.
This endpoint produces static output, so you will be viewing the end of the log file at the time of the request. More log statements might have been added after your request, so you would need to refresh the browser window to see them.

Please note that we are accessing /system/console, which will be restricted generally on public-facing instances for security purposes.

These tips should help you better understand the logging capabilities Sling offers in AEM. I hope they inspire you to start logging or expand the scope of any logging you might already have.


By aem4beginner

May 14, 2020
Estimated Post Reading Time ~

Getting AEM log files quickly for users who don't have access to the file system

Issue
In corporate organisations, for security purposes, it is common to have AEM administrator rights and OS level rights (especially file system access rights) separated to different individuals.

In this case the AEM administrator needs to request the OS administrator to send him the log files. This might be problematic when it comes to urgent issues that require quick investigations.

Solution
AEM provides 2 ways to access the logs without the need of special rights. You only need to have access rights to the AEM Web Console or the administrative tools section of AEM. Here a the 2 options:

AEM Web Console Log Files Page
Browse/export them directly from the AEM Web Console Log Files page: 

http://localhost:4502/system/console/status-slinglogs


The page displays each AEM log files one after the other as text.

You can download the log files using one of the 4 download buttons displayed on the top-right.
Download As Text = a single .txt file containing all the logs
Download As Zip = a zip file containing all the logs in seperate files
Download Full Text = a single .txt file containing all the logs + all the configurations and status available in the Web Console
Download Full Zip = a zip file containing all the logs + all the configurations and status available in the Web Console in separate files

System Diagnosis Page
Download a system status ZIP export from the system diagnosis page: http://localhost:4502/libs/granite/operations/content/diagnosis.html (select “Download Status ZIP”)


The ZIP downloaded will contain many configuration and status files including a folder with all the log files of AEM.


By aem4beginner

How to rotate request.log and access.log

Issue
The request.log and access.log log files are not rotated by default, and therefore can grow unbounded, and consume a significant amount of disk space.

Solution
Use the Felix Web Management Console to enable log rotation for bothrequest.log and access.log by configuration. CQ5, which is based on Apache Sling, allows for repository-based OSGi configuration, which is automatically picked up and registered during runtime.

The Content Package at the bottom of this document contains the required configuration for the log-rotation. Install this package via the CRX Package Manager, then restart the instance so the changes take effect.

Then, you have log rotation through the configuration of the log writers.

DOWNLOAD Get file log_rotation_config_100528.zip


By aem4beginner

Overview on AEM Logging

AEM offers you the possibility to configure:
  • global parameters for the central logging service
  • request data logging; a specialised logging configuration for request information
  • specific settings for the individual services; for example, an individual log file and format for the log messages
These are all OSGi configurations.

Note:
Logging in AEM is based on Sling principles. See Sling Logging for further information.

Global Logging
Apache Sling Logging Configuration is used to configure the root logger. This defines the global settings for logging in AEM:
  • the logging level
  • the location of the central log file
  • the number of versions to be kept
  • version rotation; either maximum size or a time interval
  • the format to be used when writing the log messages
Note:
This Knowledge Base article explains how to rotate the request.log and access.log files.

Loggers and Writers for Individual Services
In addition to the global logging settings, AEM allows you to configure specific settings for an individual service:
  • the specific logging level
  • the location of the individual log file
  • the number of versions to be kept
  • version rotation; either maximum size or the time interval
  • the format to be used when writing the log messages
  • the logger (the OSGi service supplying the log messages)
This allows you to channel log messages for a single service into a separate file. This can be particularly useful during development or testing; for example, when you need an increased log level for a specific service.

AEM uses the following to write log messages to file:
  1. An OSGi service (logger) writes a log message.
  2. A Logging Logger takes this message and formats it according to your specification.
  3. A Logging Writer writes all these messages to the physical file that you have defined.
These elements are linked by the following parameters for the appropriate elements:
  • Logger (Logging Logger)
    • Define the service(s) generating the messages.
  • Log File (Logging Logger)
    • Define the physical file for storing the log messages.
    • This is used to link a Logging Logger with a Logging Writer. The value must be identical to the same parameter in the Logging Writer configuration for the connection to be made.
  • Log File (Logging Writer)
    • Define the physical file that the log messages will be written to.
    • This must be identical to the same parameter in the Logging Writer configuration, or the match will not be made. If there is no match then an implicit Writer will be created with default configuration (daily log rotation).
STANDARD LOGGERS AND WRITERS
Certain Loggers and Writers are included in a standard AEM installation.
The first is a special case as it controls both the request.log and access.log files:
The Logger:
  • Apache Sling Customizable Request Data Logger
  • (org.apache.sling.engine.impl.log.RequestLoggerService)
  • Write messages about request content to request.log.
Links to:
  • Apache Sling Request Logger
  • (org.apache.sling.engine.impl.log.RequestLogger)
  • Writes the messages to either request.log or access.log.
  • These can be customized if required, though the standard configuration is suitable for most installations.
  • The other pairs follow the standard configuration:
The Logger:
  • Apache Sling Logging Logger Configuration
  • (org.apache.sling.commons.log.LogManager.factory.config)
  • Writes Information messages to logs/error.log.
Links to the Writer:
  • Apache Sling Logging Writer Configuration
  • (org.apache.sling.commons.log.LogManager.factory.writer)
The Logger:
  • Apache Sling Logging Logger Configuration
  • (org.apache.sling.commons.log.LogManager.factory.config.649d51b7-6425-45c9-81e6-2697a03d6be7)
  • Writes Warning messages to ../logs/error.log for the service org.apache.pdfbox.
Does not link to a specific Writer so will create and use an implicit Writer with default configuration (daily log rotation).

CREATING YOUR OWN LOGGERS AND WRITERS
You can define your own Logger / Writer pair:
Note:
In certain circumstances you may want to create a custom log file.


By aem4beginner

May 12, 2020
Estimated Post Reading Time ~

4 Ways Sling Logging Makes You a Better Developer

Logging is a critical component of developing stable and secure applications. When used correctly, logs can provide insight into application topics like security, performance, debugging, and more. In Adobe Experience Manager (AEM), you can leverage Sling Logging to diagnose salient issues, like slow loading times and component or page load failures. If you are familiar with Log4j or Simple Logging Facade for Java (SLF4J), your experience will accelerate your understanding of Sling Logging within AEM.

Here are four tips that show the usefulness and flexibility of Sling Logging:
1. Acquiring and Using a Logger Instance

AEM includes the org.apache.sling.commons.log bundle with the implementation of SLF4J. The SLF4J framework allows you to interact with the logging system in AEM. You can easily acquire an SLF4J Logger instance in your own class via the LoggerFactory:

Which will produce output similar to the following in the logs/error.log file:

2. Using the Groovy SLF4J Annotation

If you are developing with Groovy, you can use the @Slf4j annotation to automatically set up an org.slf4j.Logger log object. You won’t have to manually set up a Logger from the LoggerFactory and your fully qualified class name will already be associated with the log object. Ultimately, this will give you the same type of Logger instance as the previous example, but with less boilerplate code involved.
Here is an example:

Which will produce output similar to the following in the logs/error.log file:

3. AEM Logs Default Output File
You might be wondering why the previous examples info and error log events both output to the logs/error.log file and what configuration controls this. There is a Sling Log Support configuration page where loggers can be created and edited with the following properties:

Log Level: The broadest log level the logger will respond to.

Additive: Controls whether logged events are forwarded to parent loggers.

Log File: Relative path to a file where log statements will be appended.
Logger: An identifier/label for the logger.

Any Logger instance that you create that has no existing logger configuration will be interpreted as a child of the default ROOT logger. All logging statements produced by the child logger will be forwarded to the parent logger, using its configuration instead. The ROOT logger outputs to logs/error.log by default, so this is why your Logger instance statements end up in logs/error.log.

You might notice the other loggers that exist on your instance by default, like log.history. This logger tracks when AEM users view or modify pages and assets and outputs these events to logs/history.log.

If you wanted to hook into this logger and append log statements to logs/history.log, you would want to specify the logger identifier log.history when grabbing a Logger instance from the LoggerFactory.

Here is an example:

Which will produce output similar to the following in the logs/history.log file:
4. Log Tail Endpoint

The Sling Log Support page in the AEM Web Console reveals another useful feature for viewing logs remotely.

You will need to provide request parameters to specify what log contents you want to see:

name: URL encoded relative path to the desired log file. Example: %2Flogs%2Ferror.log

tail: Number of lines to display, starting at the end of the file.
grep: Option to filter out the results.
This endpoint produces static output, so you will be viewing the end of the log file at the time of the request. More log statements might have been added after your request, so you would need to refresh the browser window to see them.
Please note that we are accessing /system/console, which will be restricted generally on public-facing instances for security purposes.

These tips should help you better understand the logging capabilities Sling offers in AEM. I hope they inspire you to start logging or expand the scope of any logging you might already have.


By aem4beginner

May 10, 2020
Estimated Post Reading Time ~

Logging in AEM

Global Logging
Apache Sling Logging Configuration is used to configure the root logger. This defines the global settings for logging in AEM:
  • the logging level
  • the location of the central log file
  • the number of versions to be kept
  • version rotation; either maximum size or a time interval
  • the format to be used when writing the log messages
Loggers and Writers for Individual Services
In addition to the global logging settings, AEM allows you to configure specific settings for an individual service:
  • the specific logging level
  • the location of the individual log file
  • the number of versions to be kept
  • version rotation; either maximum size or the time interval
  • the format to be used when writing the log messages
  • the logger (the OSGi service supplying the log messages)
AEM uses the following to write log messages to file:
  1. An OSGi service (logger) writes a log message.
  2. A Logging Logger takes this message and formats it according to your specification.
  3. A Logging Writer writes all these messages to the physical file that you have defined.
Create a Custom Log File
In certain circumstances, you may want to create a custom log file with a different log level. You can do this in the repository by:

If not already existing, create a new configuration folder (sling:Folder) for your project /apps/<project-name>/config.

Under /apps/<project-name>/config, create a node for the new Apache Sling Logging Logger Configuration:

Name: org.apache.sling.commons.log.LogManager.factory.config-<identifier> (as this is a Logger)
Where <identifier> is replaced by free text that you (must) enter to identify the instance (you cannot omit this information). For example, org.apache.sling.commons.log.LogManager.factory.config-MINE
Type: sling:OsgiConfig

Set the following properties on this node:
Name: org.apache.sling.commons.log.file
Type: String
Value: specify the Log File; for example, logs/myLogFile.log
Name: org.apache.sling.commons.log.names
Type: String[] (String + Multi)
Value: specify the OSGi services for which the Logger is to log messages; for example, all of the following:
  • org.apache.sling
  • org.apache.felix
  • com.day
Name: org.apache.sling.commons.log.level
Type: String
Value: specify the log level required (debug, info, warn or error); for example debug
Configure the other parameters as required:
Name: org.apache.sling.commons.log.pattern
Type: String
Value: specify the pattern of the log message as required; for example,
{0,date,dd.MM.yyyy HH:mm:ss.SSS} *{4}* [{2}] {3} {5}

This step is only necessary when a new Writer is required (i.e. with a configuration that is different to the default Writer).

Under /apps/<project-name>/config, create a node for the new Apache Sling Logging Writer Configuration:
Name: org.apache.sling.commons.log.LogManager.factory.writer-<identifier> (as this is a Writer)
As with the Logger, <identifier> is replaced by free text that you (must) enter to identify the instance (you cannot omit this information). For example, org.apache.sling.commons.log.LogManager.factory.writer-MINE
Type: sling:OsgiConfig

Set the following properties on this node:
Name: org.apache.sling.commons.log.file
Type: String
Value: specify the Log File so that it matches the file specified in the Logger;
for this example, ../logs/myLogFile.log.
Configure the other parameters as required:
Name: org.apache.sling.commons.log.file.number
Type: Long
Value: specify the number of log files you want kept; for example, 5
Name: org.apache.sling.commons.log.file.size
Type: String
Value: specify as required to control file rotation by size/date; for example, ‘.’yyyy-MM-dd

Read your new log file with your chosen tool.
The log file created by this example will be ../crx-quickstart/logs/myLogFile.log.

The Felix Console also provides information about Sling Log Support at ../system/console/slinglog; for example http://localhost:4502/system/console/slinglog.

Apache Sling Logging Configuration
Configure:

  • Log Level and Log File, to define the location and log level of the central logging configuration (error.log). The level can be set to one of DEBUG, INFO, WARN, ERROR, and FATAL.
  • A number of Log Files and Log File Threshold to define the size and version rotation of the log file.
  • Message Pattern defines the format of the log messages.
For further information see AEM Logging and Sling Logging.

Apache Sling Logging Logger Configuration (Factory Configuration)
Configure:

  • Log Level, Log File, and Message Format to define details of the log file and messages.
  • Logger to define the category; for example, only log for com.day.cq.
  • By using Factory Configurations, any number of additional configurations can be added to cater to the various log levels and categories needed.
  • Such configurations are helpful during development; for example, to log TRACE messages for a specific service in a specific log file.
  • Such configurations are helpful in a production environment; for example, to have messages about a specific service logged to an individual log file for easier monitoring.
For further information see AEM Logging and Sling Logging. 

Apache Sling Logging Writer Configuration (Factory Configuration)
Configure:

  • Log File to define the existence of a log file.
  • Number of Log Files to define the version rotation.
  • The writer can be used by an Apache Sling Logging Logger Configuration configuration.
  • Such configurations are helpful during development; for example, to log TRACE messages for a specific service in a specific log file.
  • Such configurations are helpful in a production environment; for example, to have messages about a specific service logged to an individual log file for easier monitoring.
Logging in AEM is based on Sling principles
\crx-quickstart\logs
  1. access.log: All access requests to CQ WCM and the repository are registered here.
  2. error.log: Error messages (of varying levels of severity) are registered here.
  3. request.log: Each access request is registered here together with the response. 
  4. server.log: All actions made by the server are registered here.
  5. stderr.log: Holds error messages, again of varying levels of severity, generated during startup.
  6. stdout.log: Holds logging messages indicating events during startup.


By aem4beginner

May 4, 2020
Estimated Post Reading Time ~

AEM Chrome Plug-in - Log Tracer

Quick Links
AEM Chrome Plug-in Download
Sling Log Tracer 1.0.2+ Bundle Download

Requirements
  1. Requires AEM 6.0+
  2. Requires Apache Sling Log Tracer v1.0.2+ to be installed and enabled on the target AEM instance
  3. This is is a development tool and should not be used on production instances.
  4. ACS AEM Tools is not required
Purpose
AEM Chrome Plug-in - Log Tracer is a Chrome browser extension that exposes server-side log information per-request in the browser.
AEM Chrome Plug-in - Log Tracer collects and exposes per-request:
  1. AEM Logs (based on configurable package definitions)
  2. Request Progress
  3. Queries executed
How to use AEM Chrome Plug-in - Log Tracer
  1. Download and install Sling Log Tracer 1.0.2+ via AEM 6.0+ Felix Console and ensure it is started/active.
  2. Enable Sling Log Tracer via Felix ConfigMgr.
  • Make sure both “Enabled” and “Servlet Enabled” is checked.

3. Install the AEM Chrome Plug-in via the Chrome web store.
4. Open up Chrome Dev Panels (Chrome > View > Developer > Dev Tools) and click on the AEM tab.
  • Pro tip: You can drag to re-arrange Dev Tool tabs.

5. Assuming you setup Sling Log tracer properly and the default AEM settings are used (http://localhost:4502 and admin/admin), the AEM Chrome Plug-in panel will display.

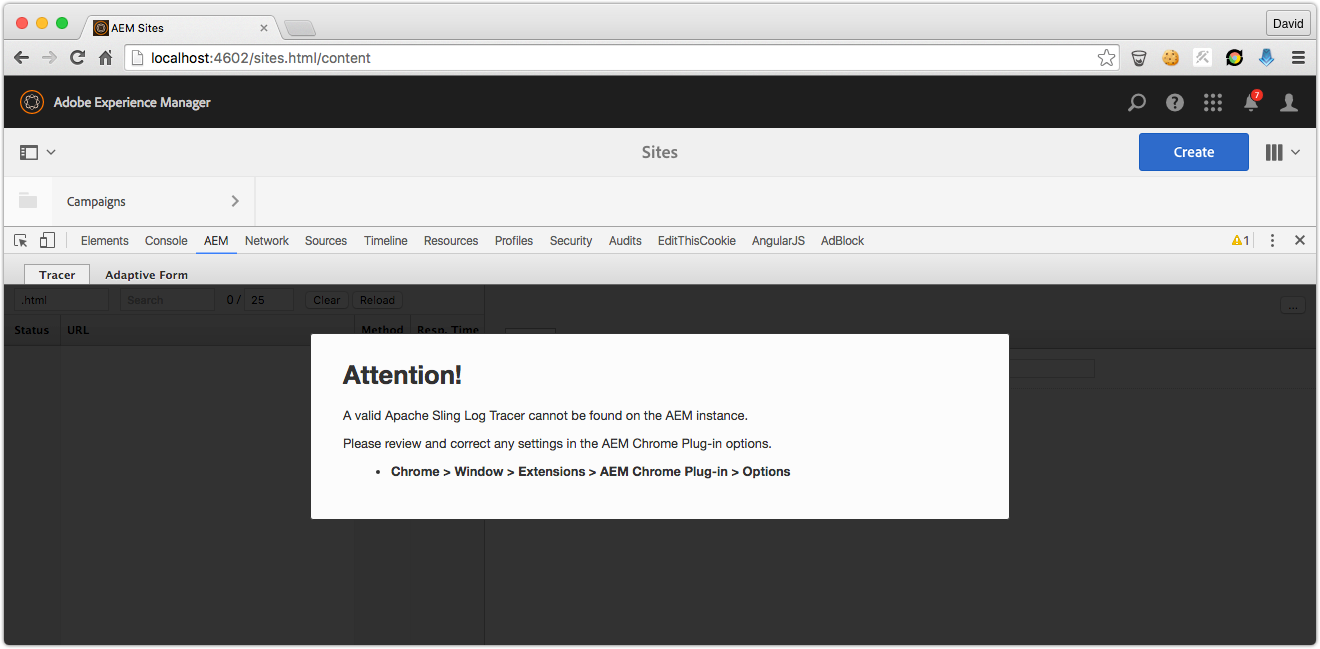
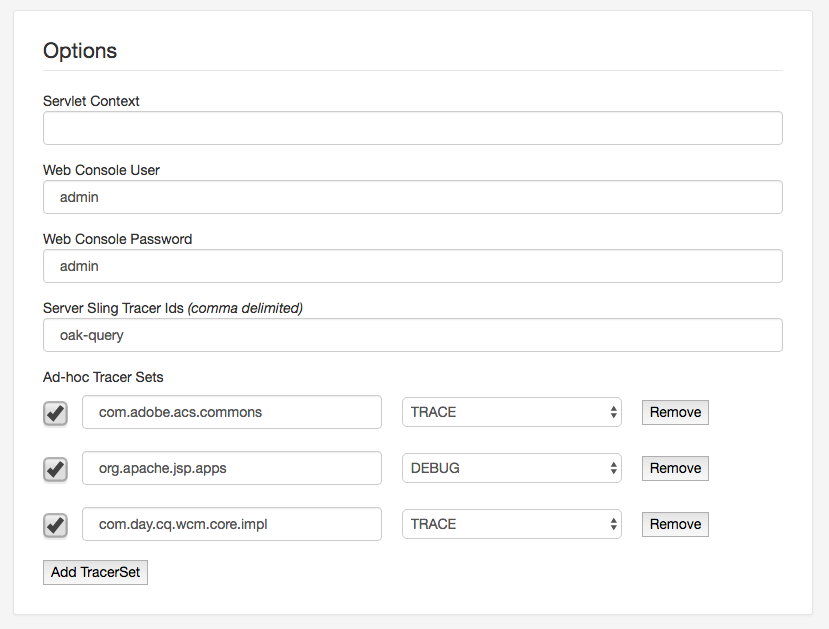
6. If something is misconfigured you will be instructed to open the AEM Chrome Plug-in Options which will guide you to correcting the problem.

7. Open the AEM Chrome Plug-in Options as instructed (Chrome > Window > Extensions > AEM Chrome Plug-in > Options)

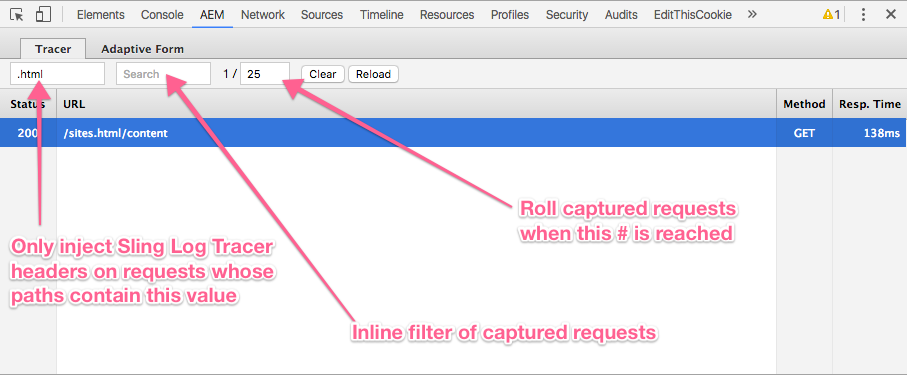
8. After AEM Chrome Plug-in Options does not report any issues, close and re-open Chrome dev tools (Step 4)
9. Use the AEM Chrome Plug-in!


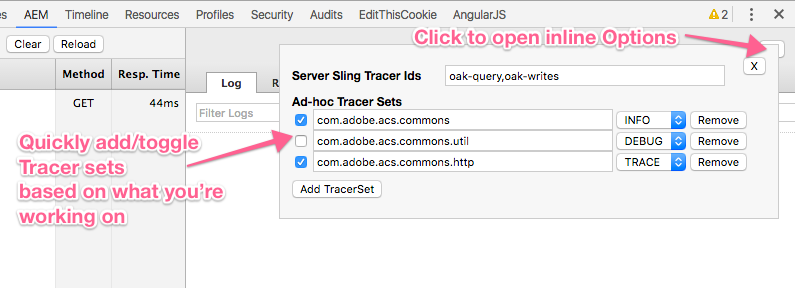
10. Pro tip: Use the inline “Mini-options” to quickly tune what data you’re collecting based on what you’re working on.

11. Pro tip: You can download logs to your local machine so you can open then in your favorite log viewer

How AEM Chrome Plug-in - Log Tracer Works
AEM Chrome Plug-in works in conjunction with Apache Sling Log Tracer to collect and expose server-side data to the browser.
  1. AEM Chrome Plug-in intercepts requests made from Chrome browser to AEM 6.0+
  2. AEM Chrome Plug-in injects Sling Log Tracer headers defining what data Sling Log Tracer should collect for that request on the AEM server.
  3. When the HTTP Request returns, a Sling Log Tracer UUID is provided in the HTTP Response. AEM Chrome Plug-in uses this UUID in a background HTTP Request to AEM to retrieve the log data collected by Sling Log Tracer.
  4. AEM Chrome Plug-in parses and injects the log data into the AEM Chrome Plug-in Dev Panel.


By aem4beginner

April 29, 2020
Estimated Post Reading Time ~

How to change the log file name and location in AEM

In an AEM Instance, error.log is the file that logs all the error messages. To change this file’s location and name, search for the below bundles in the AEM Web Console, and open them.
  1. Apache Sling Logging Configuration
  2. Apache Sling Logging Logger Configuration
AEM Web Console can be opened at http://localhost:4502/system/console/configMgr

The log file location and name can be changed under the Log File text field.

1. Apache Sling Logging Configuration

 2. Apache Sling Logging Logger Configuration


By aem4beginner

Types of Logs in an AEM

Below are the different logs which are generated by AEM. These logs can be found at <path-to-installation>/crx-quickstart/logs folder.
  1. access.log – All access requests to AEM WCM and the repository are registered here.
  2. audit.log – Moderation actions are registered here.
  3. error.log – Error messages (of varying levels of severity) are registered here.
  4. request.log – Each access request is registered here together with the response.
  5. stdout.log – Holds logging messages indicating events during startup.


By aem4beginner