Adobe’s David Gonzalez has built an “AEM Chrome plugin” that does this (obviously this only works in Google Chrome!). You have to:
- install the plugin in the Google Chrome browser
- provide AEM login credentials to the plugin
- install an OSGi bundle (Sling Log Tracer) in AEM
- start the OSGi bundle
- configure the OSGi bundle and then enable it
He has made two YouTube videos about it:
1) Setup and Configuration
2) How to Use
If you have admin access to the AEM server, you can also enable the Apache Sling Request Progress Tracker Log Filter (/system/console/configMgr).
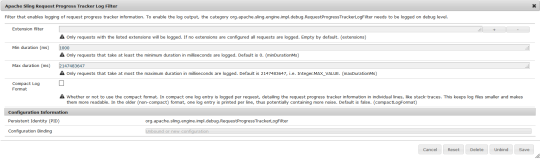
Click on image for a larger version.
Then, if you create a new Apache Sling Logging Logger configuration for org.apache.sling.engine.impl.debug.RequestProgressTrackerLogFilter (DEBUG), it will spit out similar information into its own log file.

No comments:
Post a Comment
If you have any doubts or questions, please let us know.