If you have a running instance, shut it down. We will need to configure some things and then start it up again.
Edit the “start” Executable
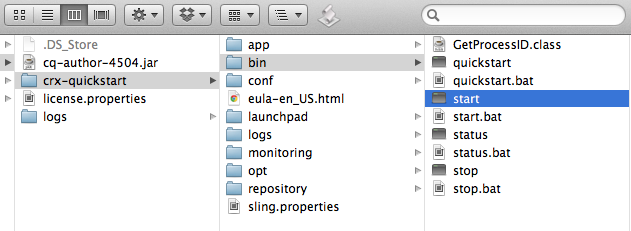
Go into crx-quickstart –> bin and open “start” in a text editor.
Add Debug Config Flag and Params
Now that we have “start” open in an editor, locate the CQ_JVM_OPTS string.
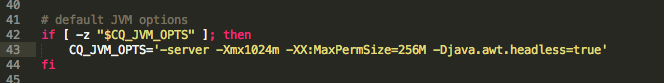
Add –Xdebug -Xrunjdwp:transport=dt_socket,server=y,suspend=n,address=8765 to the end of the CQ_JVM_OPTS string so it will look like this:

Now Save it!
Note: You can also choose any available port that you want instead of 8765.
Setting as a Profile Parameter
You can also set CQ_JVM_OPTS in your terminal profile. For bash, in your ~/.bash_profile file add the line:
export CQ_JVM_OPTS=”-server -Xmx1024m -XX:MaxPermSize=256M -Djava.awt.headless=true -Xdebug -Xrunjdwp:transport=dt_socket,server=y,suspend=n,address=8765″
Save the file and close your bash terminal. Now in any AEM instance you start with the start script it will connect to the remote debugger on port 8765 without the need to update the start script.
The only thing to be aware of is that if you try to open a second author instance, there will be a port collision because that port will already be in use from the previous instance. In this case, you will want to declare unique ports in the ./start executables.
Start the Instance
Point your terminal to the bin directory containing “start” and then run it.
terminal$ ./start
You will see during the startup process that the first thing that happens is the debugger port is opened up.

Attach the Debugger
Attaching the debugger is different for each IDE. Below are the details for IntelliJ and Netbeans.
Intellij IDEA
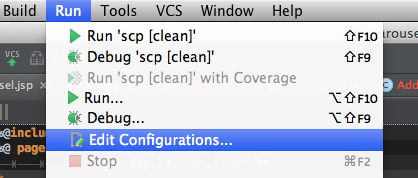
Go into Run –> Edit Configurations…
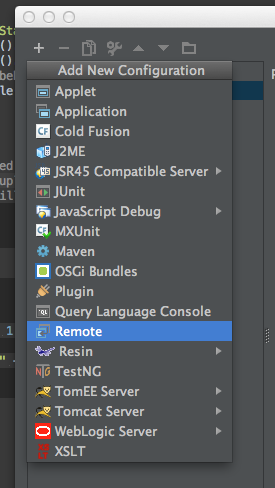
You will need to add a new remote profile by clicking the + at the top and selecting “Remote.”
Modify the settings. Here, I only had to give it a name and make the port number match what is in the start exec.
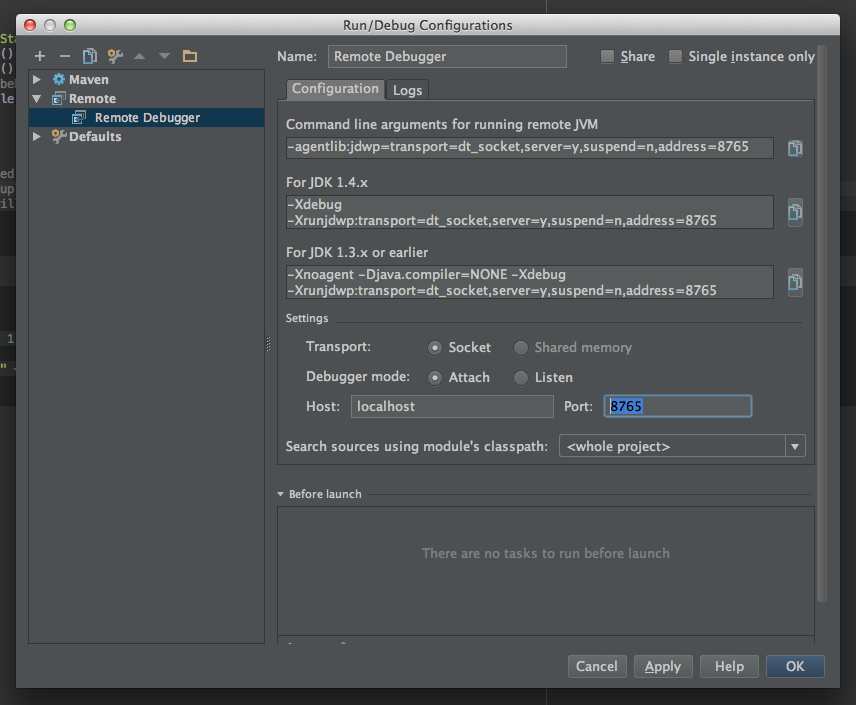
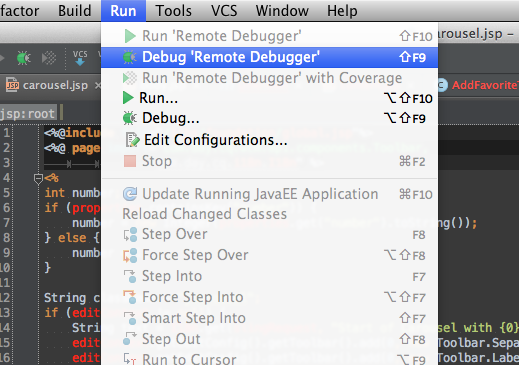
Click “OK.” Now you will see this profile listed for debugging from the Run menu. Choose it, and it will attach to your instance!
NetBeans
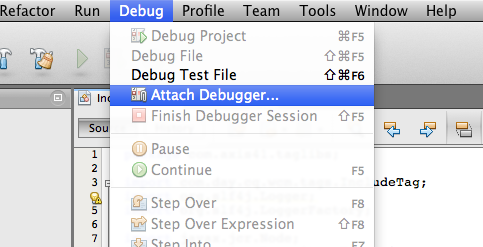
This is a little easier. Go to Debug –> Attach Debugger from the top menu.
The only thing in the dialog I had to change was the port number to make sure it matched the port we had in the start exec.
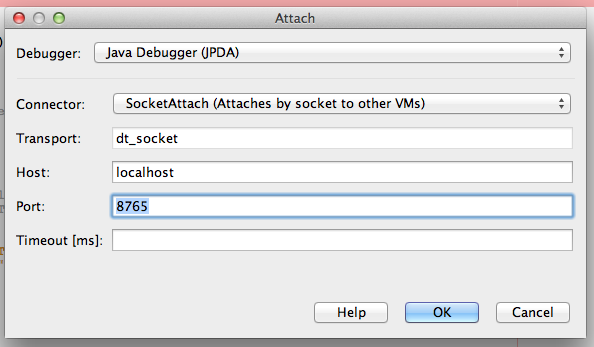
Click “OK” and it will immediately attach to your running instance.
So there you have it, a method for attaching an IDE debugger to a running instance in AEM without dozens of logger messages.

No comments:
Post a Comment
If you have any doubts or questions, please let us know.