To retrieve and get the thread dumps from a running AEM instance, open Apache Felix console then go to status >> Apache Felix Thread Dump or directly use this thread dump URL. https://localhost:4502/system/console/status-threaddump
Here we can see many download options(highlighted in below screenshot), using these download options we can download the thread dumps according to our need or just pick and copy the few threads dump from the console itself.
Image 1: Apache Felix Thread Dump console in AEM
This is how we can fetch and get the thread dump from AEM system.
Now to analyze those thread dumps we have a brilliant online tool fastThread available, using this tool we can easily analyze the thread dump.
1. Open the fastthread.io/
2. Under the Upload Thread Dumps option, we have the privilege to either use the upload or raw option.
Upload: In this case, we have to upload a file of thread dumps.
Raw: Just need to paste the content(thread dumps) in the text filed.
3. Now click on the analyze button. As soon as you clicked on the analyze button it will start analysis on our thread dumps.
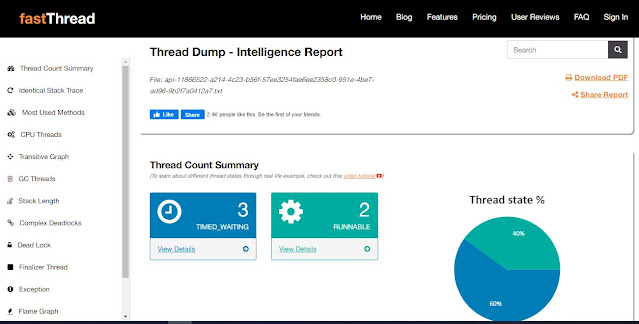
After successful analysis, it will generate a report which will look like as below.
Image 2: fastThread thread analyzer tool
In the left sidebar, we could see all headings of the report. Check all part of this report and take the right and preventive action to fix the thread or high CPU consuming issue.
References:
1. Take thread dumps from a JVM
2. https://fastthread.io/ft-index.jsp#features
3. AEM Thread Dump Analysis


No comments:
Post a Comment
If you have any doubts or questions, please let us know.