Dynatrace provides services for performance management, network monitoring, synthetic monitoring, and user monitoring.
(Gomez is owned by Dynatrace).
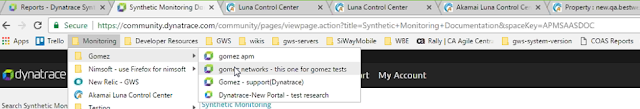
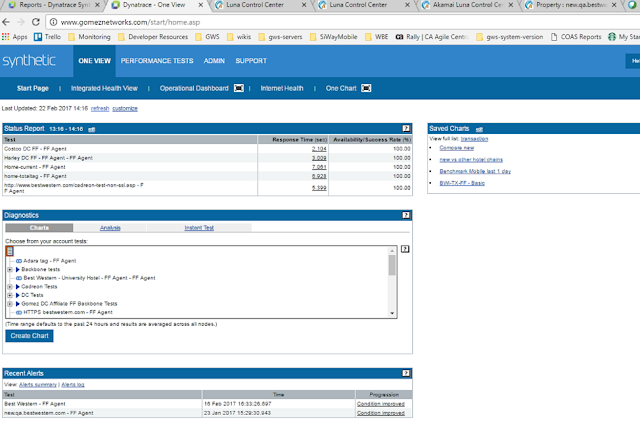
Charts—operational summary—contains many of the items we access.
There are two main tests:
Green-benchmark. Dynatrace provides. It cannot change.
Blue-backbone. It is a copy of the green test but is ours so we can add alerts.
The chart is for the last 24 periods. Need is 1 hour
Click on the root cause to get the “why”. The analyzer too will only provide performance information.
Raw data is an option but slower—drill into to get a waterfall chart then analyze data on your own.
Cide 299-Dynatrace chart code; analyzes the data for us.
Look for abnormalities in whatever object has the issue. Also, look at benchmark and backbone reports.
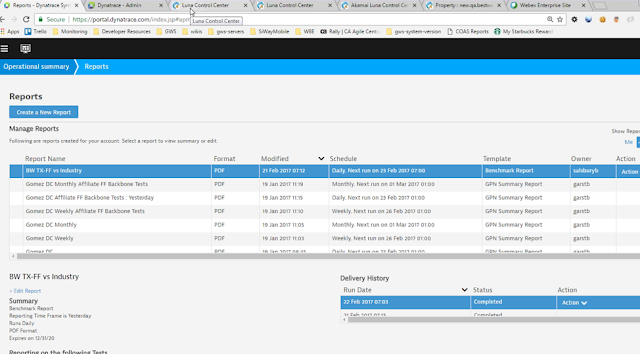
Reports—reports are coming from an older portal. BW Ops monitors this.
No benchmark failures since the weekly Friday AEM server recycles has been implemented, we have not seen any benchmark failures.
A Yellow triangle indicates a failure; click on it for RCA (Root Cause Analysis) to get additional information.
For ITSM incidents- copy text directly into the incident resolution section of the ticket.
Click on Node to see a list of where the test originated-to determine if other companies are also affected.
Options under Chart-Pre-Canned charts commonly used.
Click on Admin
Click on Reports tab:
Charts-Dyantrace
Click on Operation Summary from top left to get this menu then click on Charts:
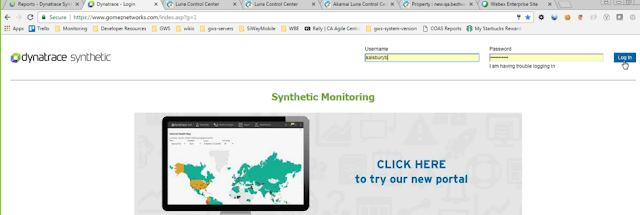
This screen will display:
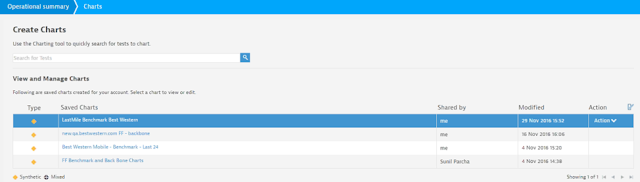
This is the clock on the FF Benchmark and Back Bones chart:
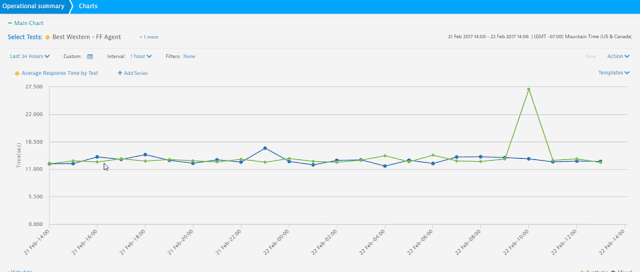
Click on one of the points to get additional information:


Select Raw Data, then select Root Cause Analysis for detailed information:


An example of a failed test:


Select a time:

From this menu pick any option. This is an example of a Node:

Click on Charts:

Click on the Mobile Benchmark (to see mobile usage):

Select a time period:

Click on Location:

Scroll down to get City and network time:


No comments:
Post a Comment
If you have any doubts or questions, please let us know.